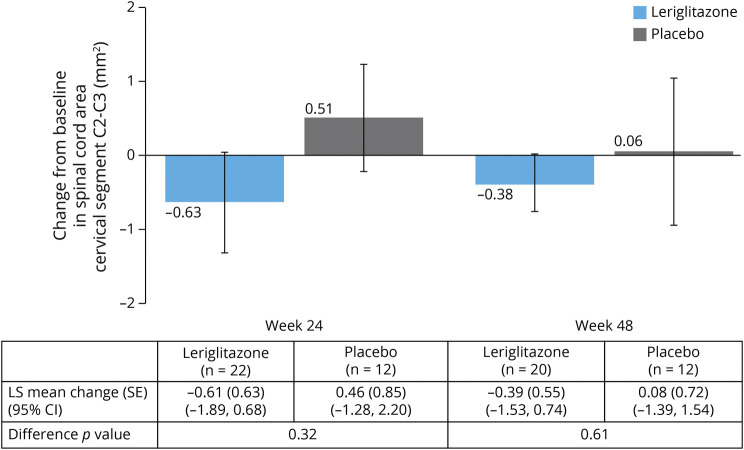
Figure 2. Change From Baseline at Week 24 and Week 48 in Spinal Cord Cervical Area Cervical Segment C2-C3 (mm2), Estimated From MRI T1-Weighted Brain Images (mITT Population) (Primary Endpoint).
Data shown are mean ± SE. The LS mean (SE), 95% CI and p value for the difference between treatment arms, as assessed by ANCOVA (with treatment arm as a fixed effect and the baseline value as a covariate) are shown in the table. Baseline was defined as the last assessment performed before or on study day 1. N values in the table show the number of patients included in the ANCOVA analyses. ANCOVA = analysis of covariance; CI = confidence interval; LS = least-squares; mITT = modified intent-to-treat; SE = standard error.

