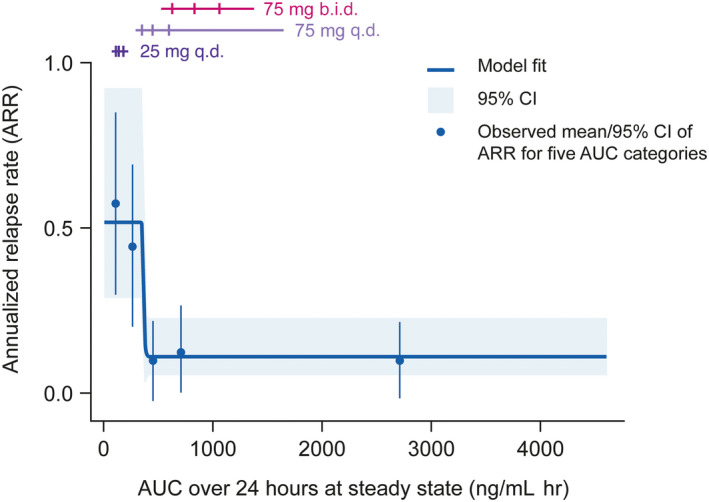
FIGURE 1.

Relationship between ARR and evobrutinib exposure (mITT population). Horizontal lines correspond to the middle 80% of the distribution of AUC by dose/regimen, the three ticks are the first, second (median), and third quartiles. Observed means (blue points) are plotted at the mid‐point of the corresponding AUC exposure group. Data shown correspond to n = 154. ARR, annualized relapse rate; AUC, area under the curve; b.i.d., twice daily; CI, confidence interval; mITT, modified intent‐to‐treat; q.d., once daily.
