FIGURE 3.

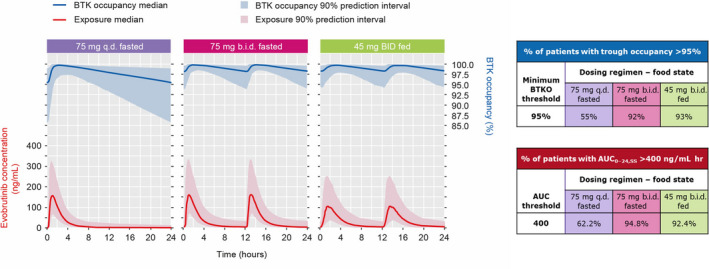
Simulation of evobrutinib concentration and BTK occupancy at steady state. AUC0–24,SS, area under the concentration–time curve over 24 h at steady‐state; b.i.d., twice daily; BTK, Bruton's tyrosine kinase; q.d., once daily.

Simulation of evobrutinib concentration and BTK occupancy at steady state. AUC0–24,SS, area under the concentration–time curve over 24 h at steady‐state; b.i.d., twice daily; BTK, Bruton's tyrosine kinase; q.d., once daily.