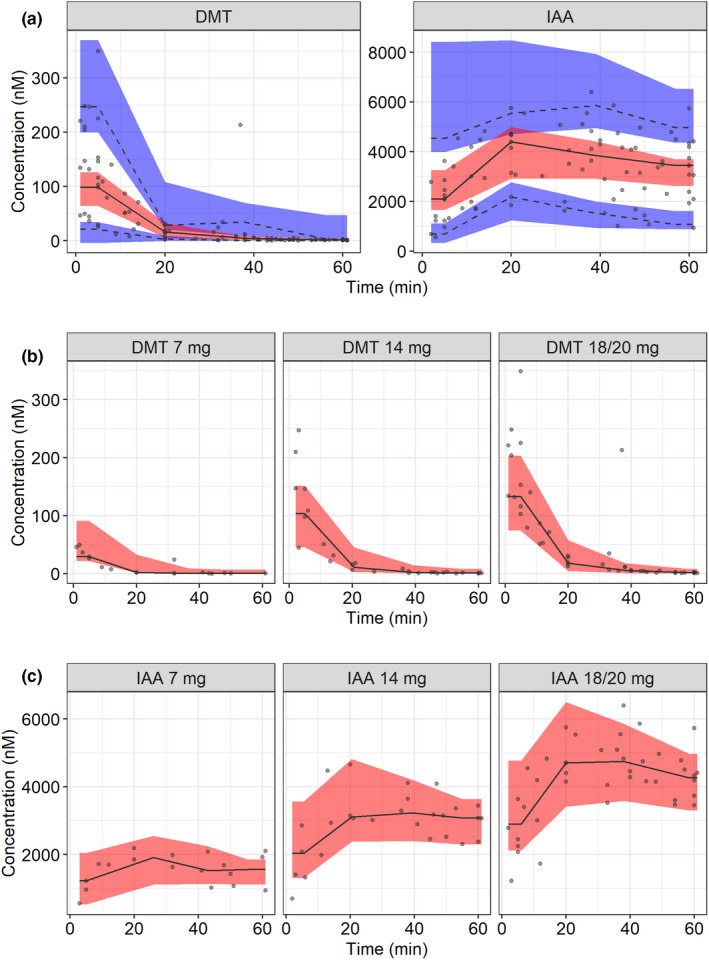
FIGURE 1.

Visual predictive check (VPC; n = 1000) of (a) the final pharmacokinetic (PK) model of N,N‐dimethyltryptamine (DMT) and the metabolite indole 3‐acetic acid (IAA) across all dose levels; (b) the final PK model of DMT stratified by dose level, and (c) the final PK model of IAA stratified by dose level in 13 healthy subjects after intravenous bolus dose. Circles are observations, solid lines are medians of the observations, dashed lines are 5th and 95th percentiles of the observations, the red areas are the 95% confidence intervals of the median of the simulated data, and the blue areas are the 95% confidence intervals of the 5th and 95th percentiles of the simulated data. The dose stratified VPCs are presented with median predictions only, due to the low sample size of each panel. Doses are expressed as DMT fumarate.
