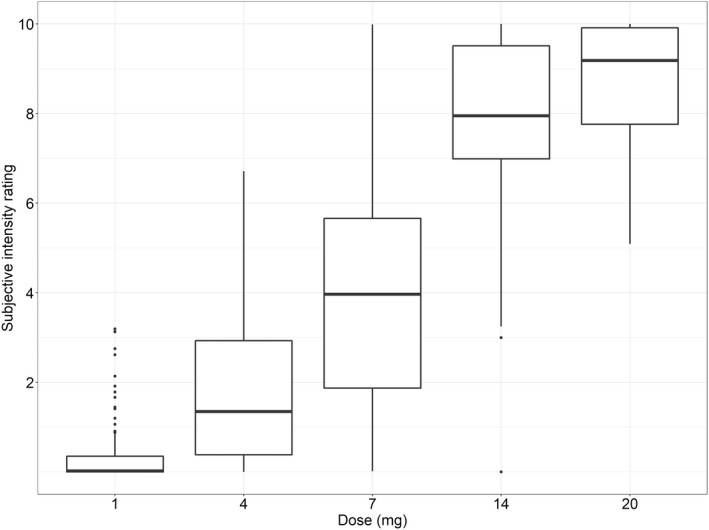
FIGURE 4.

Distribution of simulated maximum achieved effect at five different intravenously administrated N,N‐dimethyltryptamine (DMT) doses in 100 individuals, respectively. The horizontal line in the middle of the boxes is the median, the boxes indicate the 25th and the 75th percentiles, and whiskers extend between the 5th and the 95th percentiles. Doses are expressed as DMT fumarate.
