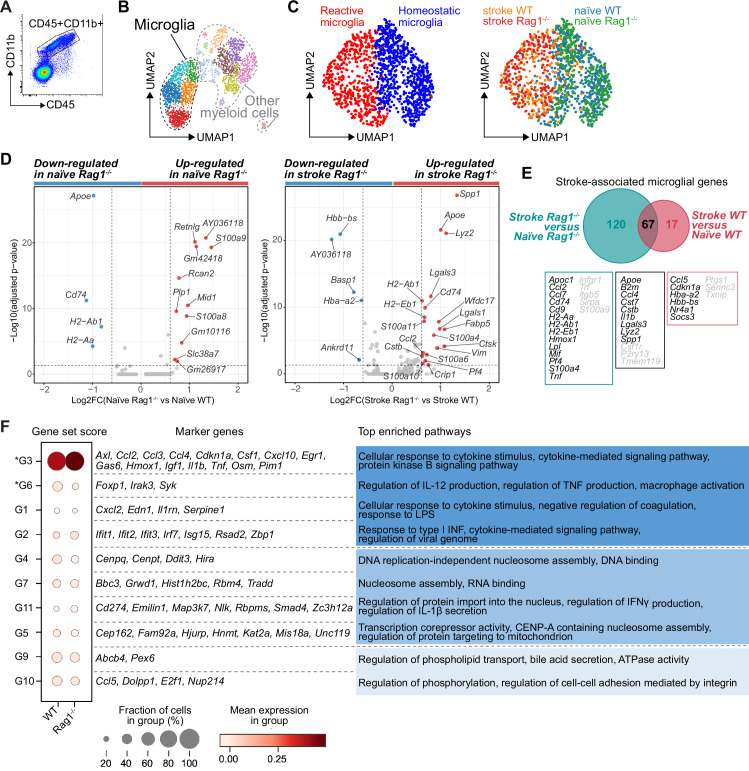
Figure 2. Lymphocytes influence microglia transcriptional signature.
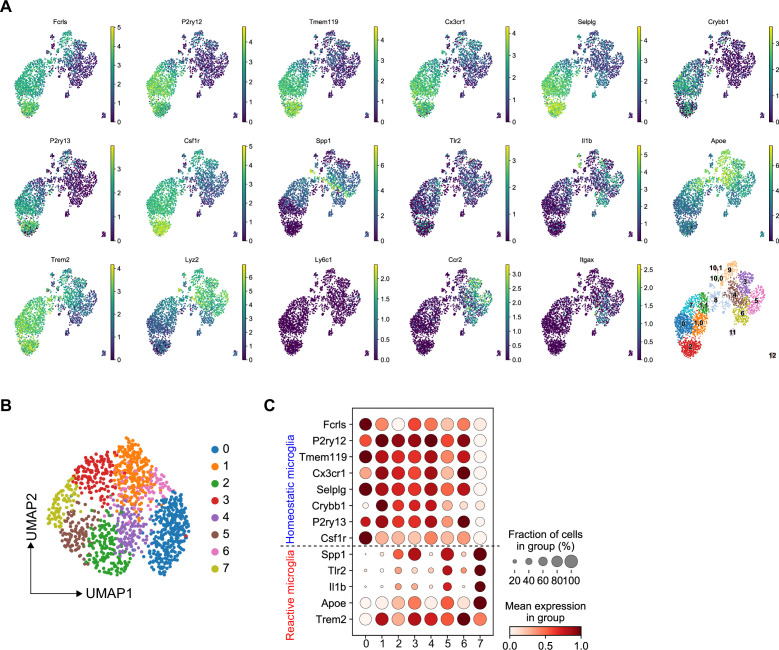
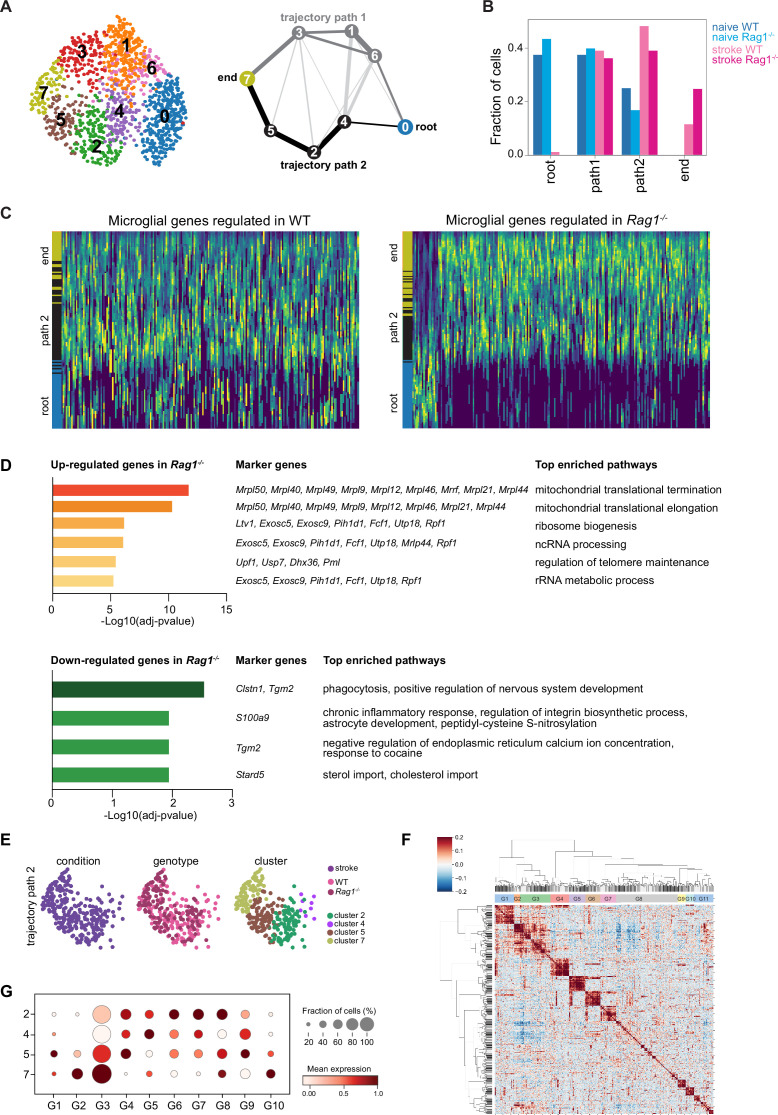
(A) CD45+CD11b+ cells were sorted from the ipsilateral hemisphere in naïve mice or 5 days after stroke in wild-type (WT) and Rag1−/− (3 mice per condition), and RNA was isolated for single cell RNA sequencing (10× Genomics). (B) Uniform manifold approximation and projection 2D space (UMAP) plots of 2345 CD45+CD11b+ cells colored by 15 distinct transcriptional clusters (Figure 2—figure supplement 1A). (C) Clustering of the microglia subset color-coded by homeostatic and reactive microglia (right) and by conditions (left). (D) Volcano plots of the differentially expressed genes in microglia in naïve and stroke condition. Dotted lines indicate an adjusted p-value≤0.05 and FC = 1.5. (E) Number of microglial genes regulated after stroke in comparison to naïve condition in Rag1−/− and WT mice. 67 genes were common to both genotypes, 17 genes were specifically regulated in WT mice and 120 genes only in Rag1−/− mice. Boxes indicate key microglial genes in each condition (genes indicated in gray were down-regulated after stroke). (F) Selected gene sets of highly correlated and anti-correlated genes based on trajectory inference analysis in stroke condition (Figure 2—figure supplement 2E–G). Mean gene set activation score in WT and Rag1−/− cells, selected marker genes, and top enriched gene ontology pathways associated to each gene set. Gene sets were classified by p-value (the lowest p-value at the top, asterisks [*] indicate significant difference between genotype in stroke condition) and by similar pathways, such as: pathways related to inflammation (dark blue), pathways related to DNA/RNA regulation (blue), and lipid pathways (light blue).


