. 2022 Dec 13;11:e79076. doi: 10.7554/eLife.79076

Figure 1. Proliferative split in basal cancer cells enables expansion of intermediate cells.

(A) Simplified schematic of single-cell RNA sequencing of WT and Ptenfl/fl ventral prostates. (B) UMAP of WT and Ptenfl/fl epithelial cells. Left, both conditions superposed; middle, WT only; right, Ptenfl/fl only. Epithelial cell types are demarcated by color (red = basal, light blue = luminal progenitor, dark blue = intermediate, green = differentiated). (C) Relative abundance of epithelial cells in WT (n=3) and Ptenfl/fl (n=2) mice. Y-axis shows the % composition of each sample by cell type (***p<0.001, negative binomial test). Data presented as +/-SD. (D) Top GSEA results enriched in Ptenfl/fl compared to WT for each epithelial subtype. Intermediate cells in Ptenfl/fl were compared to luminal progenitor cells in WT. All pathways are enriched with FDR <0.05. (E) Proliferation signature (CCP) composite score in epithelial cells, clustered by condition (Data presented as +/-SD, *p<0.05, n.s.=not significant, permutation test). N/A indicates missing data due to no cells being present in the condition. WT n=3, Ptenfl/fl n=2. (F) UMAP visualization of cell cycle phase assignment per cell, showing % cells in non-G1 (S or G2/M) (black border = WT basal cells, blue border = hypo-proliferative basal cells in Ptenfl/fl, and red border = hyper-proliferative basal cells in Ptenfl/fl. *p<0.05, chi-square test). (G) GSEA between hyper- and hypo-proliferative basal clusters in Ptenfl/fl. All pathways are enriched with FDR <0.05. (H) RNA velocity analysis of Ptenfl/fl epithelial cells; highlighted section shows intersection of basal and intermediate cells. (I) Pseudotime trajectories drawn by Palantir through the basal and intermediate compartments, with hypo-proliferating basal cells as the designated start point. (J) Expression of important cell fate and differentiation regulators along basal-intermediate trajectory.

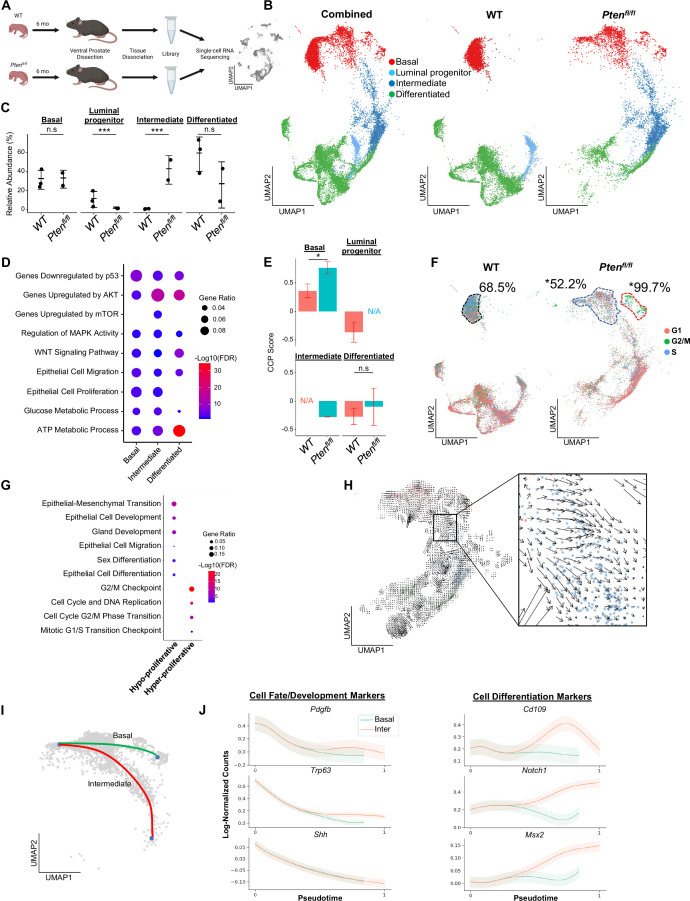
Figure 1.

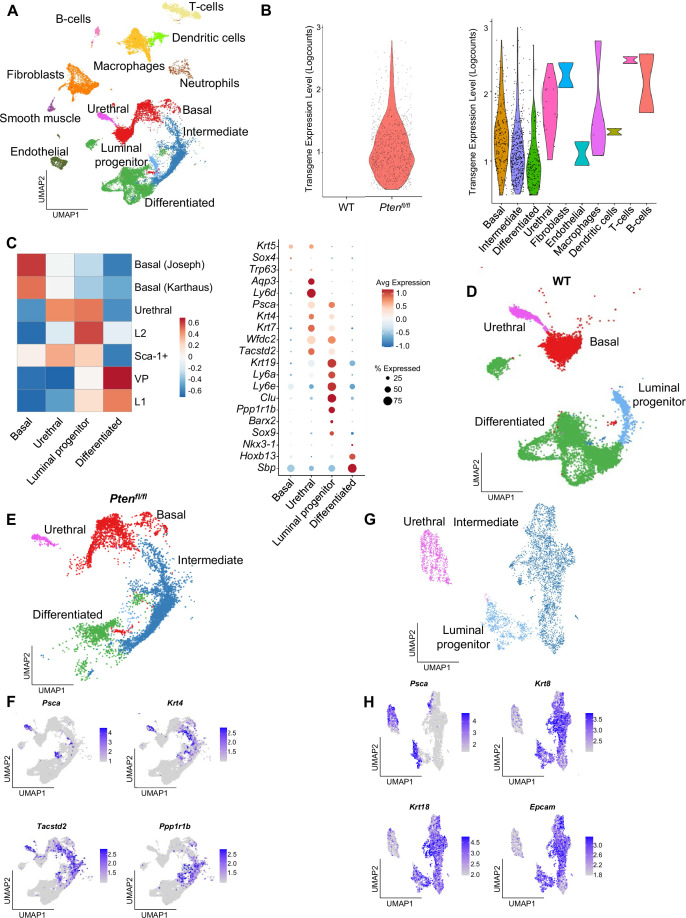
Figure 1—figure supplement 1. Epithelial cells contain published subtypes and urethral cells.

Figure 1—figure supplement 1.

(A) UMAP visualization of all cells in WT and Ptenfl/fl ventral prostates, colored and labeled by cell ID. (B) Violin plots of rtTA-eGFP transgene expression. Left, transgene expression in WT and Ptenfl/fl mice. Right, expression in Ptenfl/fl cell types. (C) Heatmap of composite scores of published prostate epithelial subtype signatures in basal, urethral, luminal progenitor, and differentiated cells in WT mice (left). Dot plot of epithelial biomarker gene expression in WT mice (right). (D) UMAP visualization of epithelial cells in WT prostates, colored and labeled by cell ID. (E) UMAP visualization of epithelial cells in Ptenfl/fl prostates, colored and labeled by cell ID. (F) UMAP visualization of published intermediate cell biomarkers in WT and Ptenfl/fl mice. (G) UMAP visualization of urethral, luminal progenitor, and intermediate cells in WT and Ptenfl/fl mice, colored and labeled by cell ID. (H) UMAP visualization of Psca, pan-epithelial and luminal biomarkers in urethral, luminal progenitor, and intermediate cells in WT and Ptenfl/fl mice.
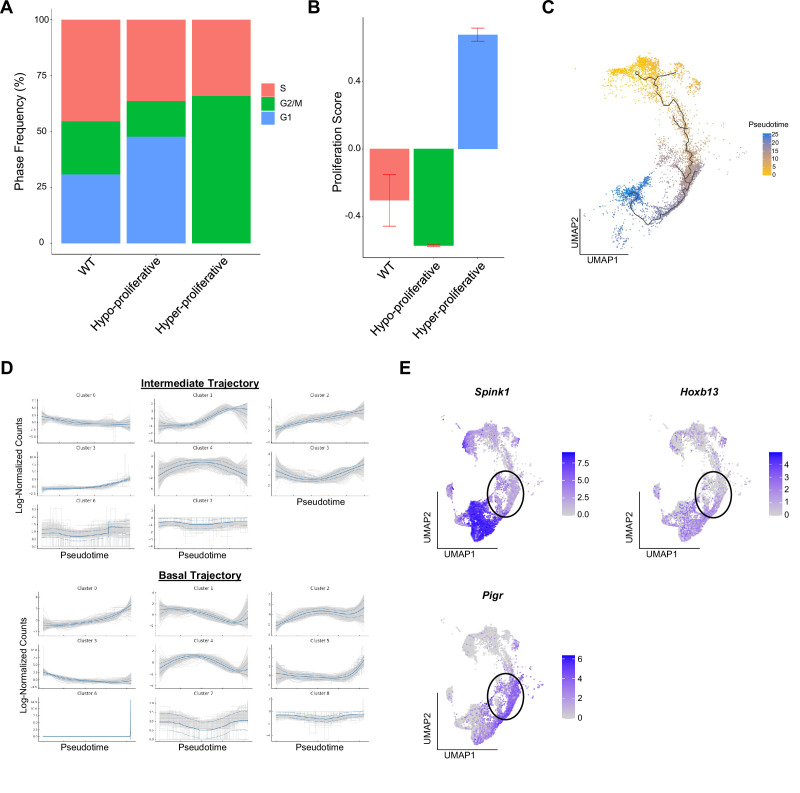
Figure 1—figure supplement 2. Basal proliferation is subset-specific and intermediate cells express luminal markers.

Figure 1—figure supplement 2.

(A) Bar plot of cell cycle phase assignments in WT basal cells and Ptenfl/fl hyper- and hypo-proliferative basal cells. (B) Bar plot of CCP signature composite score in WT (n=3) basal cells and Ptenfl/fl (n=2) hyper- and hypo-proliferative basal cells (Data presented as +/-SD). (C) Trajectory analysis of Ptenfl/fl epithelial cells. (D) Top 3000 highly variable genes in Ptenfl/fl basal and intermediate cells, clustered by expression pattern along the basal-intermediate (top) or hypo-proliferative basal-hyper-proliferative basal (bottom) trajectories drawn via Palantir (Figure 1I). (E) UMAP visualization of luminal biomarkers in epithelial cells in WT and Ptenfl/fl mice. Black circles indicate luminal-intermediate transition zone.