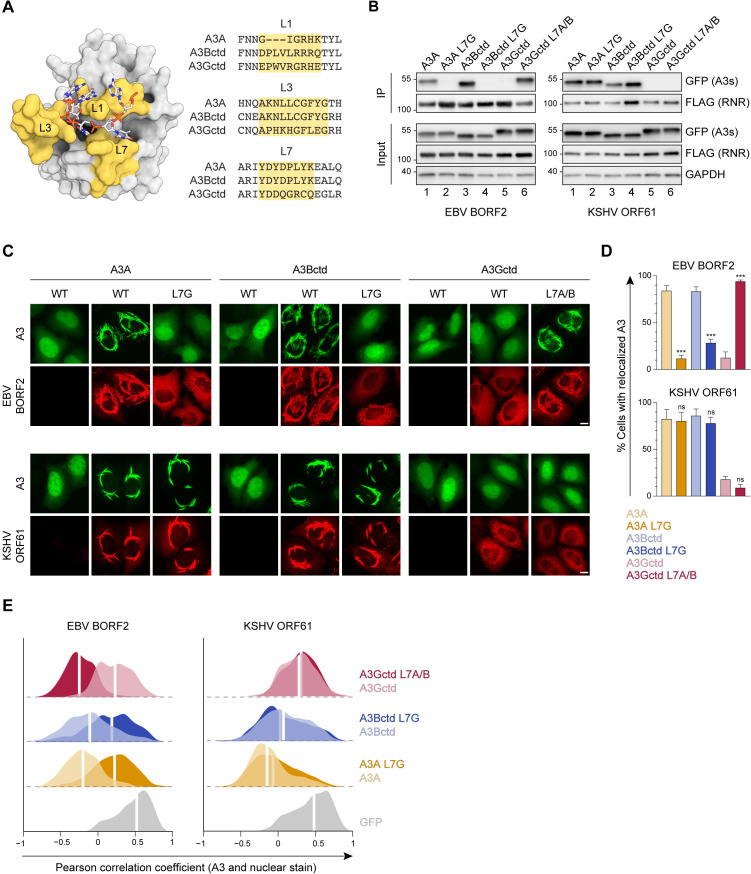
Figure 2. Involvement of the A3B and A3A loop 7 regions in binding to gamma-herpesvirus ribonucleotide reductases (RNRs).
(A) Surface-filled representation of single-stranded DNA (ssDNA) bound by an A3 (pdb 5sww, chains A and E). L1, L3, and L7 regions are colored in yellow with amino acid alignments to the right. (B) Co-immunoprecipitation (Co-IP) of A3 L7 chimeras with Epstein-Barr virus (EBV) BORF2 and Kaposi’s sarcoma-associated herpesvirus (KSHV) ORF61. FLAG-tagged RNR subunits were co-expressed with the indicated A3-EGFP constructs in 293T cells, affinity purified, and analyzed by immunoblotting to detect co-purifying A3 proteins. (C) Representative IF microscopy images of HeLa cells co-transfected with FLAG-tagged EBV BORF2 or KSHV ORF61 (red) and the indicated A3-EGFP constructs (green). Scale = 10 μm. (D–E) Quantification of A3-EGFP relocalization in HeLa cells expressing EBV BORF2 or KSHV ORF61. Panel D shows the percentage of cells exhibiting relocalized A3-EGFP (mean ± standard deviation, n≥100 cells per condition). Statistical analyses were performed using unpaired t-tests to determine significant changes in the relocalization of L7 swapped A3s (darker shade) relative to wild-type (WT) (lighter shade; n=3 independent experimental replicates; ns, not significant p>0.5; *p≤0.5; **p≤0.01; ***p≤0.001). Panel E shows Pearson correlation coefficient (PCC) values for A3-EGFP (or EGFP alone as a control) and Hoechst (nuclear stain). Density curves show the PCC value distribution in each condition, and the white vertical lines indicate the median PCC value (n≥100 cells per condition).

