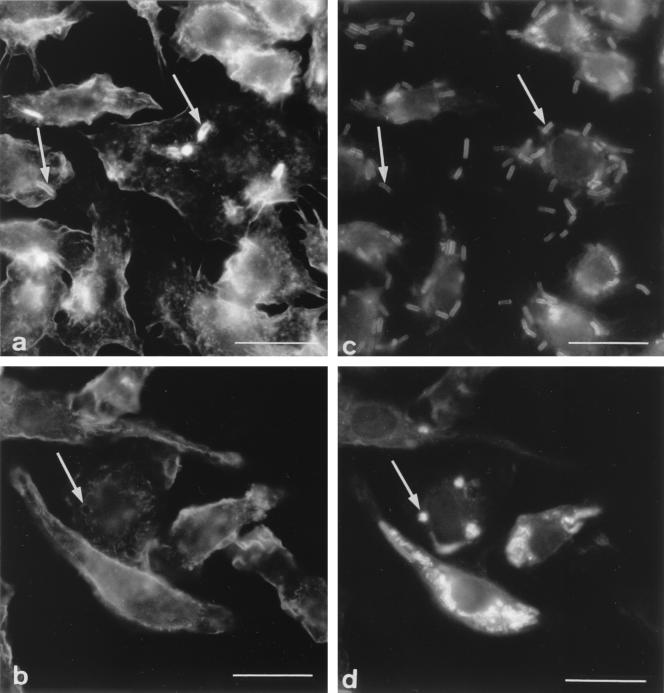
FIG. 4.
Colocalization of F-actin and phagosomes. (a and c) Five-minute exposure to B. subtilis showing the typical cap of F-actin (a; arrows) around bacteria during phagocytic uptake (c; arrows); (b and d) 45-min exposure of cells to B. subtilis showing a ring of F-actin (b; arrow) around a phagolysosome (d; arrow). Bars = 5 μm.

