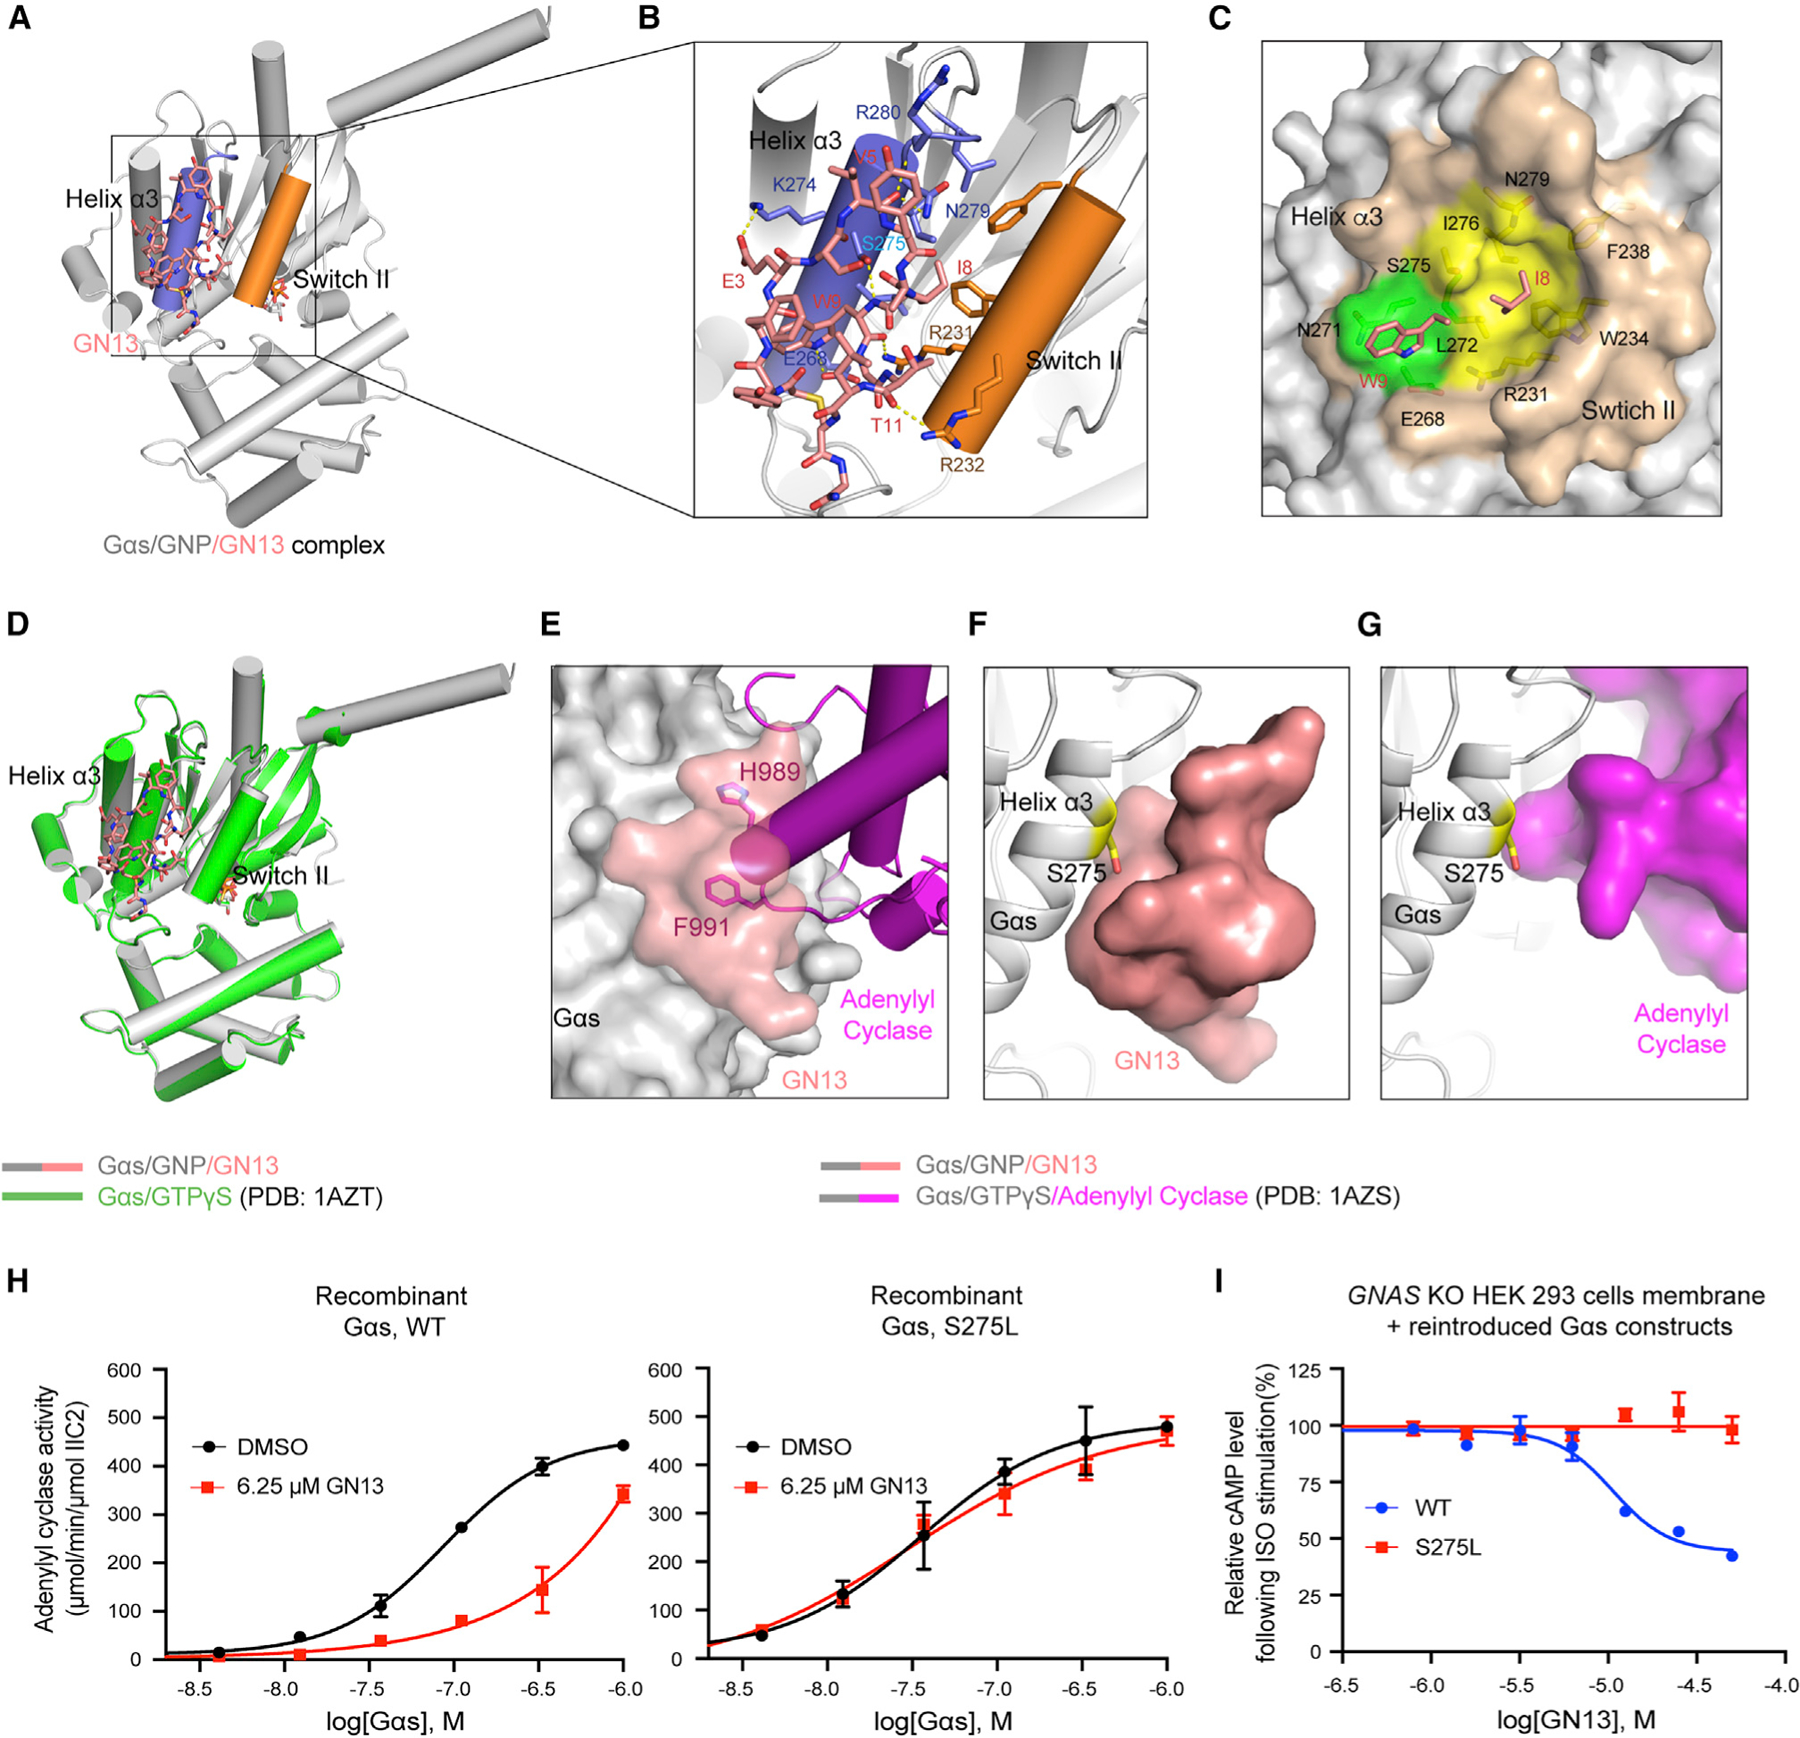
Figure 3. The crystal Structure of GppNHp-bound Gαs in complex with GN13.

(A) Overall structure of the Gαs/GNP/GN13 complex. GN13 (salmon) binds in between switch II (orange) and the α3 helix (slate).
(B) Structural details of Gαs/GN13 interaction. H-bonds are shown as yellow dashed lines.
(C) Close-up view of two Gαs hydrophobic pockets (green and yellow) that accommodate I8 and W9 of GN13 (salmon). Gαs residues that form those pockets are shown as sticks.
(D) Alignment of Gαs/GN13 structure (gray) with the structure of Gαs/GTPγS (green, PDB: 1AZT). Root-mean-square deviation = 0.479 Å.
(E) Our Gαs/GN13 (gray/salmon) structure was superimposed on the Gαs/AC complex structure (gray/magenta, PDB: 1AZS). GN13 blocks H989/F991 of AC from binding to the same pocket in Gαs.
(F and G) Close-up view of the interaction between GN13 (salmon) and the Gαs α3 helix (F) and the interaction between AC (magenta) and the Gαs α3 helix (G, PDB: 1AZS). S275 is shown as sticks.
(H) Gαs WT and Gαs S275L have comparable biochemical activities in the AC activation assay (black). GN13 inhibited AC activation by Gαs WT (red, left) but not by Gαs S275L (red, right). Mean ± SD, n = 3.
(I) Gαs S275L confers resistance to GN13 inhibition in HEK293 cell membranes. Mean ± SD, n = 3.
