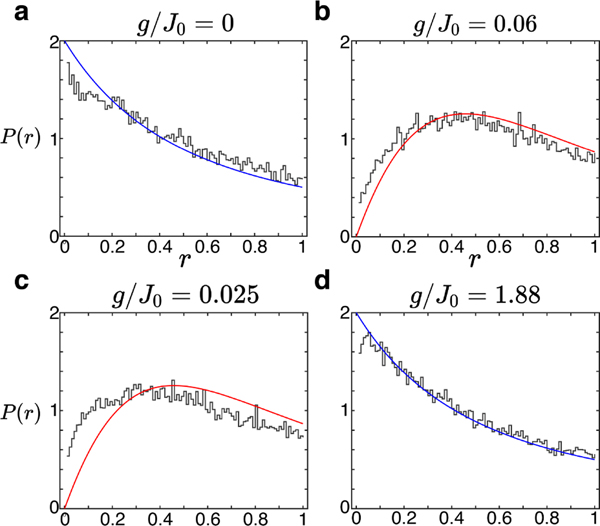
Extended Data Figure 2.
Probability density distributions of r, the ratio of adjacent energy level spacings, for the experimental Hamiltonian (Eq. 1 of the main text) at various values of g/J0 and N = 15. Numerics are compared with the distribution expected for either a Poisson level distribution (blue lines in a. and d.) or a Wigner-Dyson distribution (red lines in b. and c.). The level statistics in the absence of a field gradient are near the Poissonian limit, which may reflect the proximity to an integrable limit for the low-energy sector [56]. A small gradient results in statistics near the Wigner-Dyson limit, followed by an approach to Poisson statistics as the gradient is increased.

