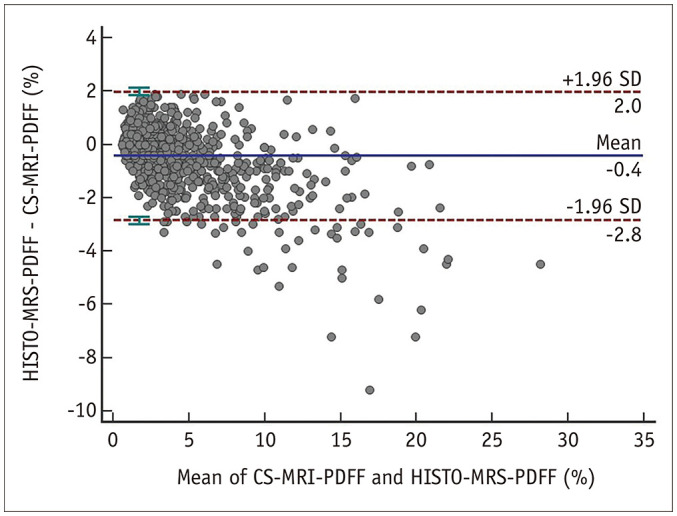
Fig. 4. Bland-Altman plot showing the relationships between CS-MRI-PDFF and HISTO-MRS-PDFF.

The X-axis represents the mean of CS-MRI-PDFF and HISTO-MRS-PDFF, and the Y-axis represents the differences between them, calculated as HISTO-MRS-PDFF minus CS-MRI-PDFF. The Bland-Altman plot reveals a bias of -0.4, with a 95% limit of agreement, ranging from -2.8 to 2.0. CS-MRI-PDFF = chemicalshift-imaging-based MRI-proton density fat fraction, HISTO-MRS-PDFF = high-speed T2-corrected multi-echo MR spectroscopy proton density fat fraction, SD = standard deviation
