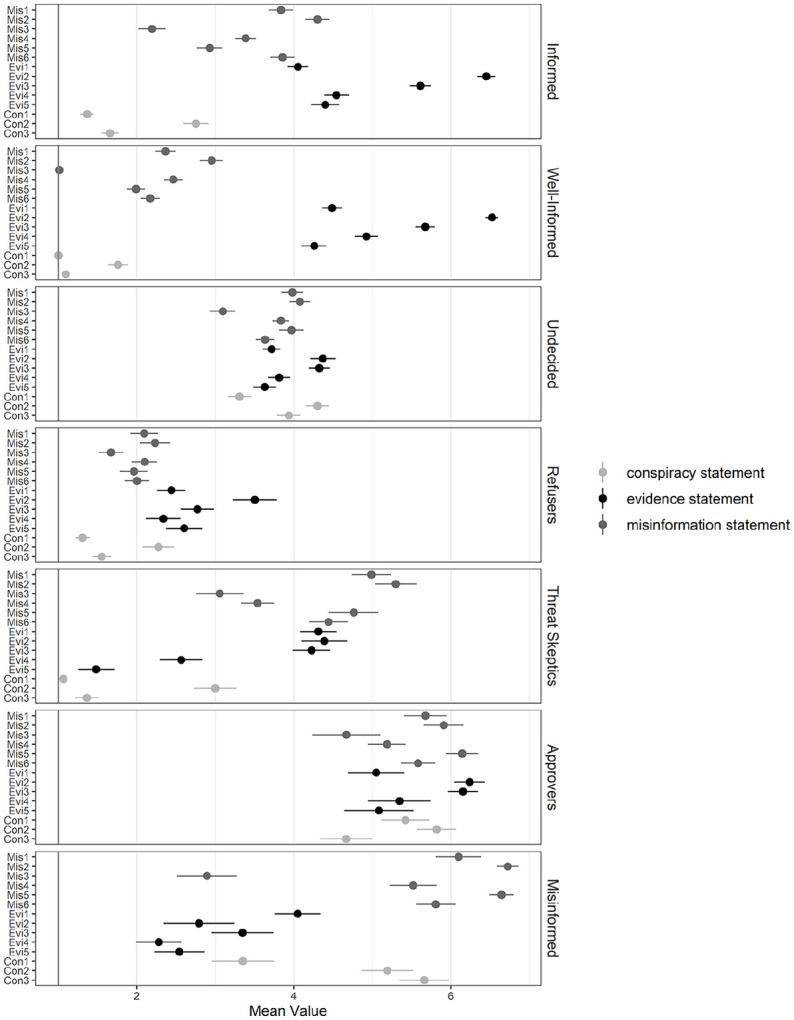
Figure 2.

Distribution of Belief in Misinformation, Evidence, and Conspiracy Statements Across Latent Belief Profiles.
Note. Vertical lines represent −/+ 1*SD. Higher values indicate higher levels of belief.

Distribution of Belief in Misinformation, Evidence, and Conspiracy Statements Across Latent Belief Profiles.
Note. Vertical lines represent −/+ 1*SD. Higher values indicate higher levels of belief.