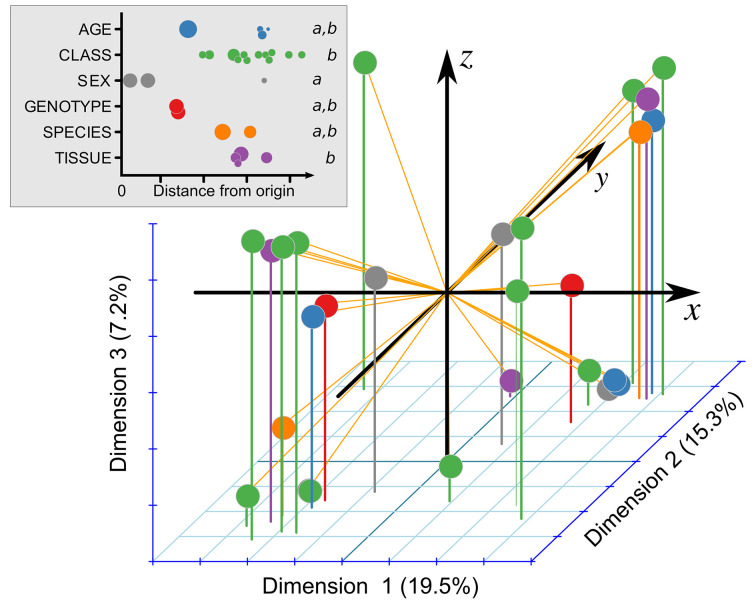
Figure 1. Relative influence of genotype (CF versus non-CF) and other factors on overall fatty acid composition.
Composition of 27 major fatty acids was subject to factor analysis on mixed data. The resulting three principal dimensions in log10 space are shown, with the explained variance per axis noted in parentheses. The upper-left inset shows the colors for each of the factors, as well as the distance from the origin for each point. The size of each point is proportional to the numbers of samples represented by the point. Italicized ‘a’ and ‘b’ indicate statistical groupings as determined by weighted one-way ANOVA followed by Tukey’s HSD.

