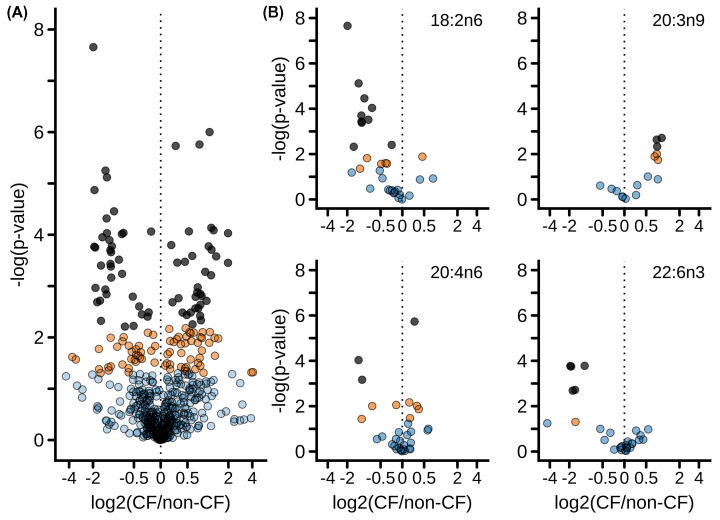
Figure 2. The impact of CF on fatty acid composition.
(A) Volcano plot showing changes in composition of individual fatty acids between CF and non-CF samples, isolating the non-genotype factors of species, tissue examined, lipid class, fed and fasting status, birth method, and age category. Each dot represents a specific fatty acid as measured in a specific species, tissue, lipid class, etc. Comparisons reaching a false discovery rate (FDR) of <0.05 are shown in dark grey fill. Comparisons reaching nominal significance with P<0.05 but false discovery rate > 0.05 are shown in orange fill. Comparisons not reaching significance (i.e. P>0.05) are shown with blue fill. (B) Volcano plot of selected fatty acids as indicated.

