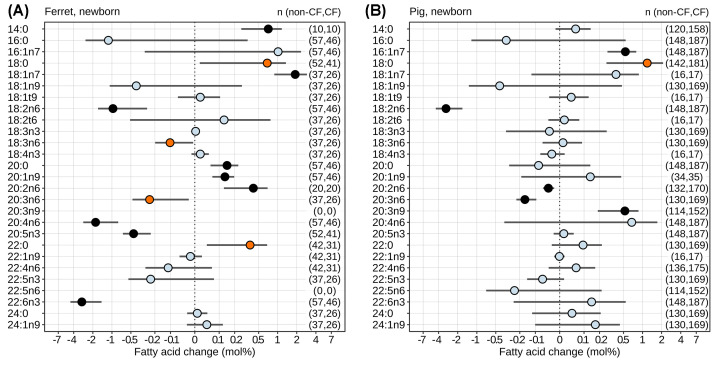
Figure 3. The impact of CF on fatty acid composition in newborns.
The effect of CF in (A) ferrets and (B) pigs on fatty acid mole% was determined by linear mixed effects modeling across the unified dataset, accounting for multiple co-variates. Mean effects (CF minus non-CF) and 95% confidence intervals (points and bars) are shown and account for multiple co-variates as described in Methods. The following factors were treated as fixed effects: CF versus non-CF, lipid class examined, tissue examined, method of birth (C-section versus vaginal), sex, never fed status, diet, and length of fast before sample collection. Animal subject and lab of analysis were treated as random factors. The two species were analyzed separately. Equivalent fatty acids from the three differing methodologies were analyzed jointly. The statistical significance of difference for each fatty acid is indicated by color: light blue, non-significant (P>0.05); orange, P<0.05 but false discovery rate (FDR) > 0.05; black, FDR < 0.05. The number of measurements (n) underlying each fatty acid assessment are shown in the right-hand side (non-CF, CF).

