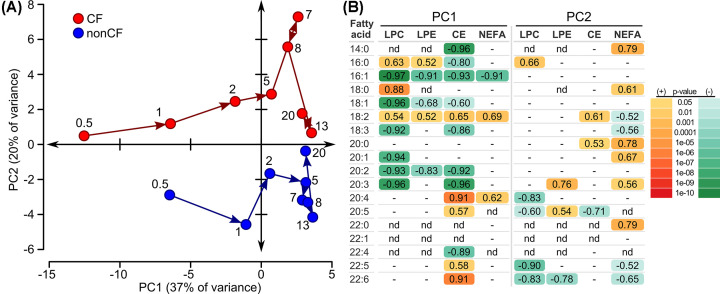
Figure 6. Ferret plasma lipid fatty acid composition changes over the first 3 weeks of life.
N = 11 ferrets per genotype, without repeated sampling, 1–4 samples per time point, 4 lipid classes represented (lysophosphatidylcholine LPC, lysophosphatidylethanolamine LPE, cholesterol esters CE, non-esterified fatty acids NEFA). Fifty-nine discrete lipid species were measured across these 4 classes, among 18 fatty acids. Unsaturated fatty acids were measured by mass spectrometry and thus omega isomer positional information was not determined. (A) Principal component analysis, plotting the changes in fatty acid profile of CF (red) versus non-CF (blue) ferrets over time. The age in days for sample collection is indicated for each point on the graph. (B) Lipid species significantly correlated with principal component axes 1 and 2 (PC1, PC2). Correlation values are shown. Only significant correlations (P<0.05) are shown, and P-values are coded by color, with different color scales used depending on whether the correlation was negative or positive. Lipid species that were not significantly correlated are marked as ‘-’. Lipid species that were not detected are marked ‘nd’.

