Fig. 1.
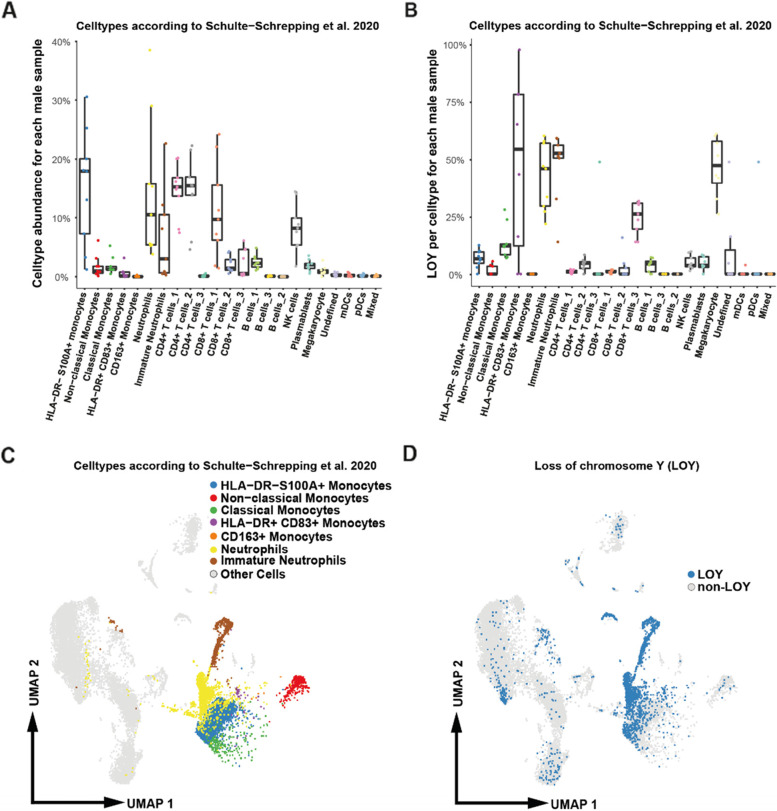
Distribution of cell types and cells with loss of chromosome Y (LOY) in PBMCs from critically ill patients with COVID-19. The dataset comes from Schulte-Schrepping et al. 2020 [19] and we used cell type annotation reported therein. Nine PBMCs samples from six male patients with WHO score >=5 were used for calculations. A Proportion of cell types in PBMCs; each data point represents a single sample. B Proportion of cells with LOY per cell type and per sample; each data point represents a single sample. C UMAP projection of scRNA-seq profiles, selected cell types are colored. D UMAP visualization of scRNA-seq profiles colored according to LOY status. Cells classified as LOY cells had no detectable expression from chromosome Y, as described [5]

