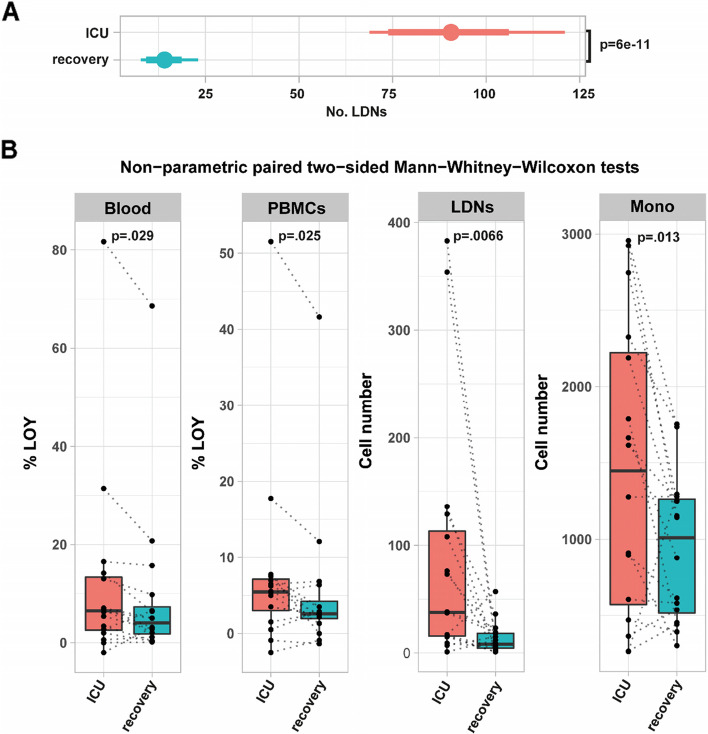
Fig. 5.
Leukocyte counts and LOY status for patients during ICU treatment and during recovery. A Age, age2, and smoking adjusted comparison of the numbers of low-density neutrophils (LDNs) at the intensive care unit (ICU, n=135) and 3–6 months after the discharge from ICU (recovery, n=16). Points denote medians; thick and thin horizontal bars show 80% and 95% HDI, respectively. B Paired comparison of unadjusted loss of chromosome Y percentages (%LOY) in whole blood and PBMC, and numbers of LDNs and monocytes cells in PBMCs in 16 patients, where both ICU and recovery samples were available. Each dotted line connects the ICU and recovery data within the same patient. Boxplots show median, IQR as hinges and largest values no further than 1.5*IQR away as whiskers. Unadjusted p-values from paired two-sided Mann-Whitney-Wilcoxon non-parametric tests are shown

