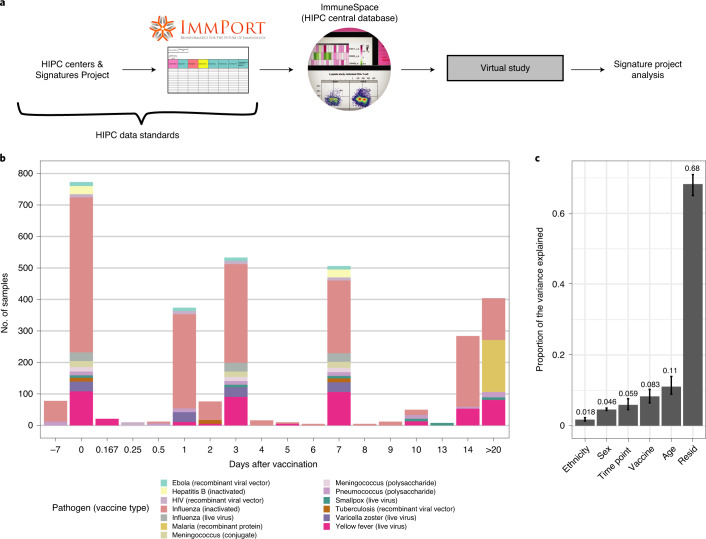
Fig. 1. Creation of a combined dataset of transcriptional responses to vaccination across diverse vaccine platforms and target pathogens.
a, Flowchart describing the collection, curation, standardization and preprocessing steps leading to the creation of the vaccine transcriptomics compendium. b, Histogram of the time points before (days −7 and 0) and after (days > 0) vaccination available in the Immune Signatures Data Resource. In the plot, each vaccine is represented by a different color, while the size of the bar is proportional to the number of samples with available transcriptomic data. Only adults aged 18–50 years, with available pre-vaccination data were included in the resource. c, Principal variance component analysis was used to estimate the proportion of the variance observed in the transcriptomic data that can be attributed to clinical (age, sex, ethnicity) and experimental variables (time after vaccination, vaccine). The proportion of the variance that could not be explained by those variables is depicted by the residuals (resid). Confidence intervals (95%, percentile method) and bar height (mean) were computed from 4,000 bootstrap replicates.

