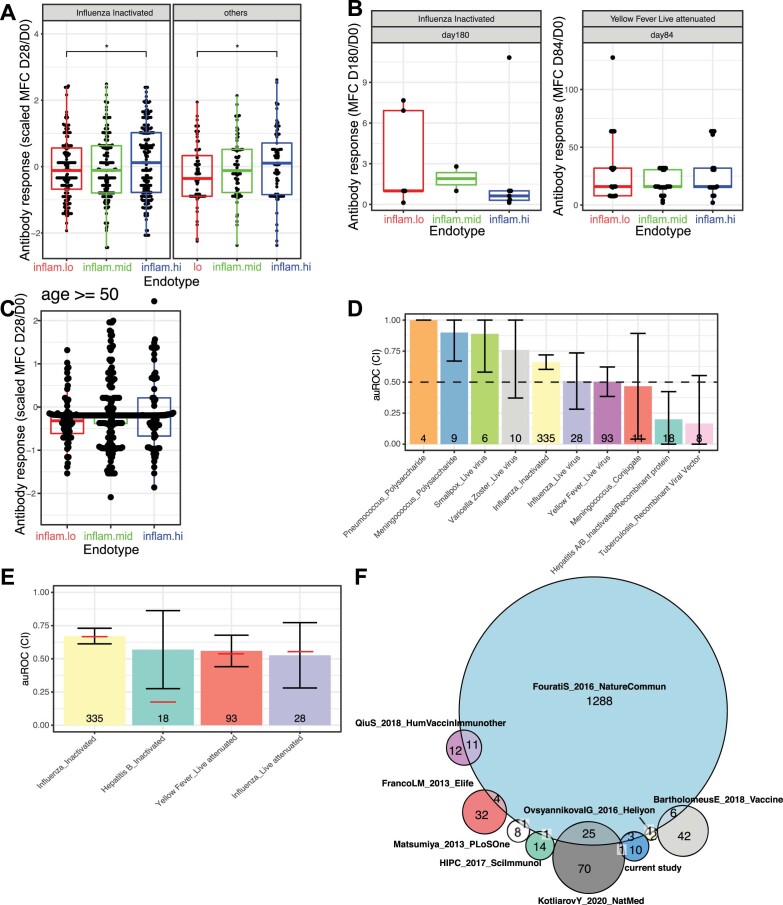
Extended Data Fig. 4. Pre-vaccination endotypes predict antibody response to vaccines.
(a) Association between the unsupervised pre-vaccination cluster and antibody response at day 28 for (right) Influenza inactivated vaccines and (left) other vaccines. For each boxplot, the vertical line indicates the median, the box indicates the interquartile range, and the whiskers indicate 1.5 times the interquartile range. Wilcoxon rank-sum test between two endotypes: p-values less than 0.05 are flagged with one star (*), p-values less than 0.01 are flagged with 2 stars (**), and p-values less than 0.001 are flagged with three stars (***). (B) Association between the unsupervised pre-vaccination cluster and antibody response at day 180 for the inactivated influenza vaccine (left) and day 84 yellow fever vaccine (right). For each boxplot, the vertical line indicates the median, the box indicates the interquartile range, and the whiskers indicate 1.5 times the interquartile range. (c) Association between the unsupervised pre-vaccination cluster and antibody response at day 28 for healthy adults aged 50 and above. For each boxplot, the vertical line indicates the median, the box indicates the interquartile range, and the whiskers indicate 1.5 times the interquartile range. (d) Accuracy of the supervised classifier to predict the antibody response groups per vaccine. Mean and 95% CI for auROC across the 10-folds for each vaccine separately. (e) Accuracy of supervised classifiers trained on a specific vaccine and tested on the same vaccine by cross-validation. The red line indicates the accuracy of the pan-vaccine classifier while the bar represents the 95% CI calculated by 10-fold cross-validation. (f) Venn diagram of the overlap of inflammatory genes and previously identified pre-vaccination signature of vaccine response.

