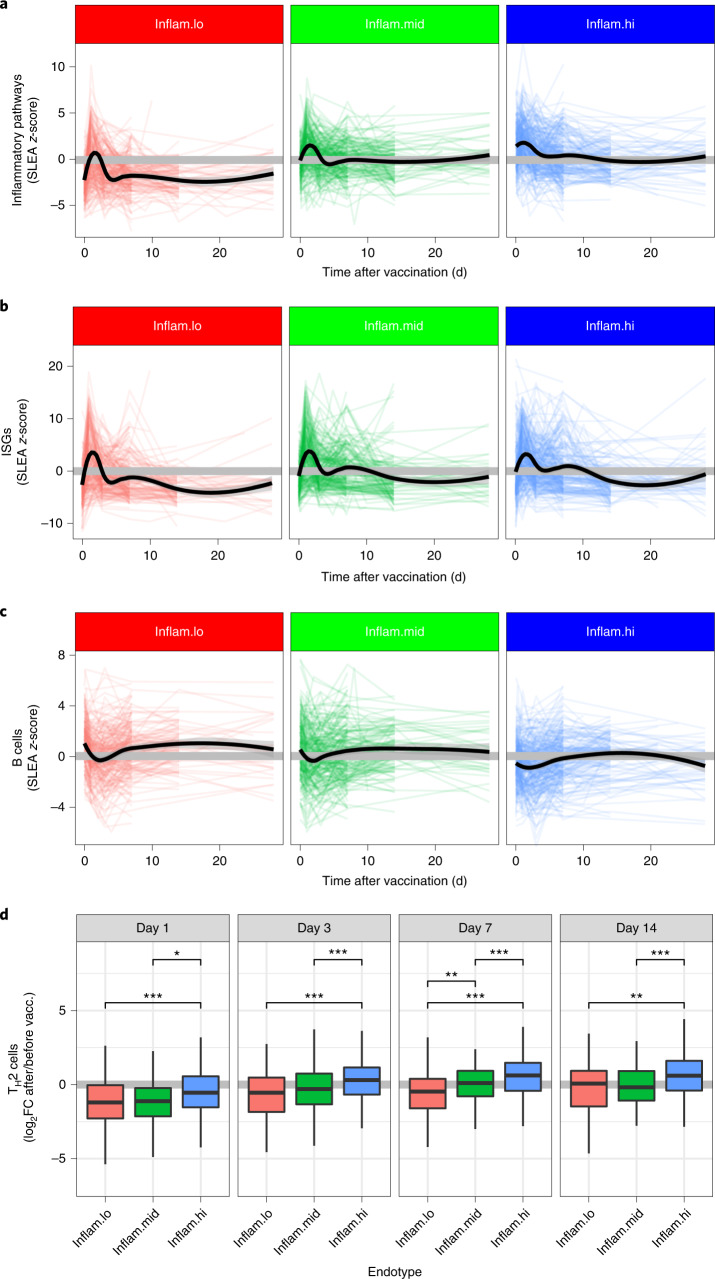
Fig. 3. Kinetics of the vaccine response are dictated by the pre-vaccination endotypes.
a–c, Line plots showing the expression of inflammatory pathways (a), ISGs (b) and B cells (c) as a function of time, separated by participants with low, middle or high pre-vaccination inflammation (inflam.lo, n = 235; inflam.mid, n = 237; inflam.hi, n = 304). Each colored line corresponds to one participant. LOESS regression was used to determine the average expression per pre-vaccination endotype (black lines). d, TH2 cell markers fold change values over pre-vaccination data for several time points after vaccination (day 1, inflam.lo n = 117, inflam.mid n = 117, inflam.hi n = 139; day 3, inflam.lo n = 166, inflam.mid n = 165, inflam.hi n = 202; day 7, inflam.lo n = 159, inflam.mid n = 147, inflam.hi n = 198; day 14 inflam.lo n = 81, inflam.mid n = 103, inflam.hi n = 100). For each box plot, the vertical line indicates the median, the box indicates the interquartile range, and the whiskers indicate 1.5 times the interquartile range. Wilcoxon rank-sum test; *P < 0.05, **P < 0.01 and ***P < 0.001.

