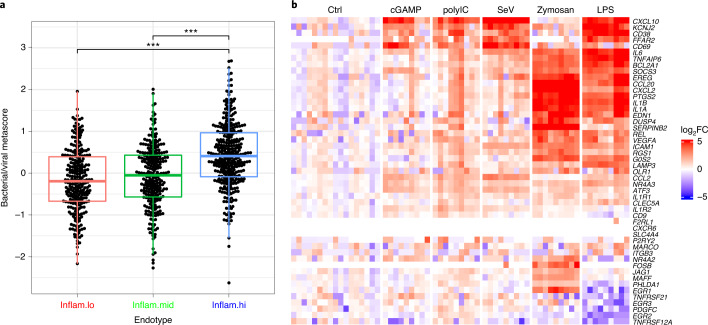
Fig. 6. Etiology of the pre-vaccination endotypes.
a, Box plot showing the bacterial/viral metascore as a function of the pre-vaccination inflammatory endotypes (inflam.lo, n = 241; inflam.mid, n = 249; inflam.hi, n = 317). For each boxplot, the vertical line indicates the median, the box indicates the interquartile range, and the whiskers indicate 1.5 times the interquartile range. A Wilcoxon rank-sum test without correction for multiple testing was used to assess the difference in bacterial/viral metascore between two endotypes: *P < 0.05, **P < 0.01 and ***P < 0.001. b, Gene expression of the inflammatory genes, identified as being associated with antibody response by the unsupervised and supervised approaches, in DCs from three independent donors stimulated for 6 h with five PRR ligands.

