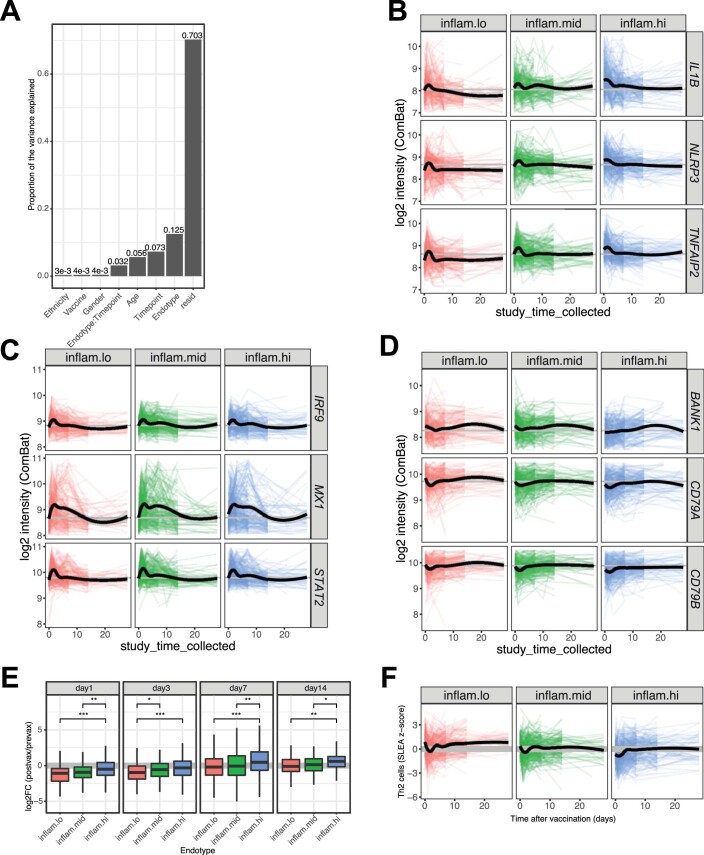
Extended Data Fig. 3. Pre-vaccination endotypes affect post-vaccination transcriptomic response.
(a) Principal variance analysis with the inflammatory states. Canonical inflammatory genes (b), interferon-stimulated genes (c), and B cell markers (d) expression over time in the three inflammatory states. (e) Log2 fold-change over pre-vaccination levels of B cell markers. For each boxplot, the vertical line indicates the median, the box indicates the interquartile range, and the whiskers indicate 1.5 times the interquartile range. Wilcoxon rank-sum test between two endotypes: p-values less than 0.05 are flagged with one star (*), p-values less than 0.01 are flagged with 2 stars (**), and p-values less than 0.001 are flagged with three stars (***). (f) Th2 cell markers over time.

