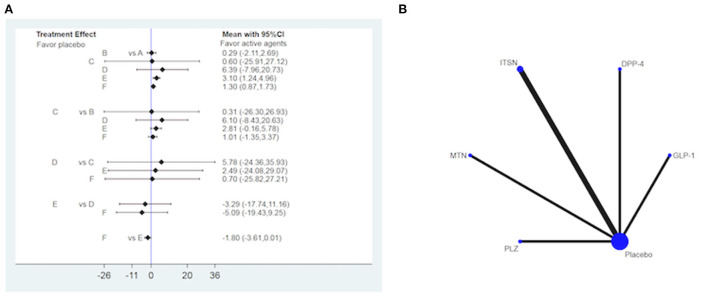
Figure 4.
Forest plot (A) and network map (B) for hypoglycemic drugs (HD) with placebo in improving Aβ42. (A) A: placebo, B: intranasal insulin, C: metformin, D: pioglitazone, E: glucagon-like peptide-1, F: dipeptidyl peptidase 4 inhibitor. (B) Lines connect the interventions that have been studied in head-to-head comparisons in eligible RCTs. The width of the lines represents the total number of RCTs for each pairwise comparison. The size of each node is proportional to the number of randomized participants. Metformin (MTN), Pioglitazone (PLZ), Intranasal insulin (ITSN), Glucagon-like peptide-1 (GLP-1), Dipeptidyl peptidase 4 inhibitor (DPP-4).

