Figure 1.
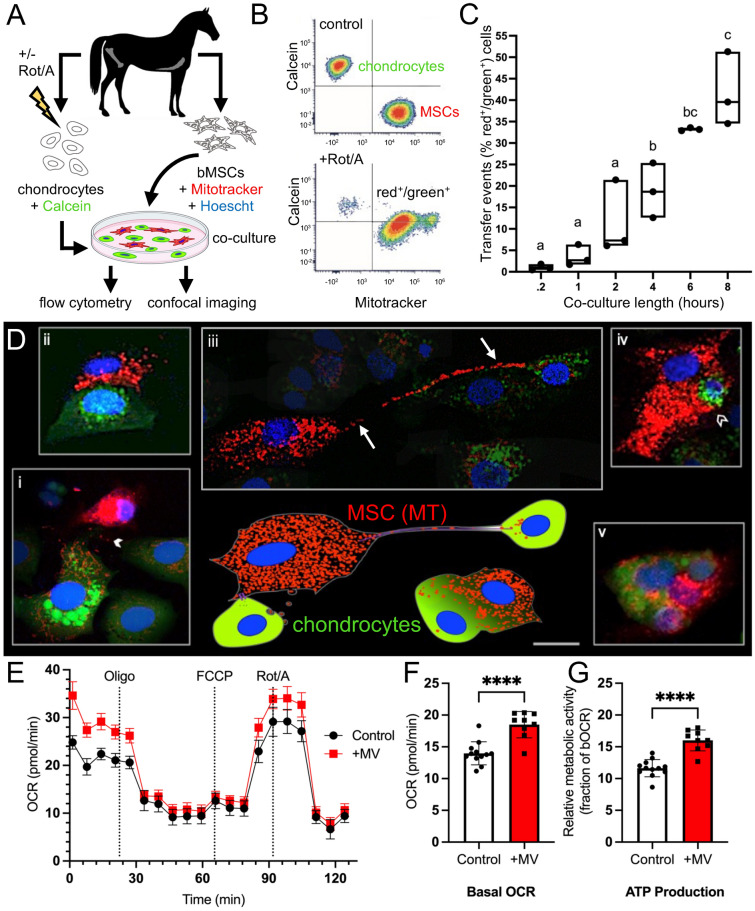
Equine mesenchymal stromal cells (MSCs) transfer mitochondria (MT) to chondrocytes over time and via several modes and increase MT function. (A) Experimental design (B) Representative flow cytometry plots. Top plot shows results of separately cultured equine chondrocytes stained with Calcein AM (4 mM) and MSCs stained with MitoTracker Deep Red (200 nM) used to set quadrant gates; bottom plot shows red+/green+ chondrocytes (upper right-hand quadrant) after rotenone and antimycin (Rot/A; 0.5 μM/0.5 μM) stimulation and co-culture with MSCs. (C) MT transfer (% red+/green+ cells) increases with length of co-culture, n = 3. (D) Schematic (bottom center) depicting observed modes of MT transfer from MSCs (red MT, blue nuclei) to chondrocytes (green cytoplasm, blue nuclei) alongside corresponding confocal microscopy images (i-v), taken up to 8 h after initiation of co-culture, stained as above with the addition of Hoechst (5 mg/L, blue) to MSCs before co-culture; representative images of (i) likely gap junction-mediated microvesicle (MV, arrowhead) transfer, (ii) close cellular contact without apparent transfer demonstrating the broad range of observed cell–cell interactions, (iii) possible tunneling nanotubule-mediated filopodial (arrows) transfer, (iv) apparent phagocytosis-like event (open arrowhead), (v) cell fusion event. Note that in (i) and (iii), contrast in surrounding cells was decreased 10–20% to highlight the mentioned interaction; Bar ≅ 10 µm. (E) Equine chondrocyte oxygen consumption rate (OCR) during real-time microscale respirometry (Seahorse MT stress test) with and without MV treatment. (F) Respirometry data shows MV treatment increases equine chondrocyte basal OCR. (G) ATP production in equine chondrocytes increases with MV treatment.

