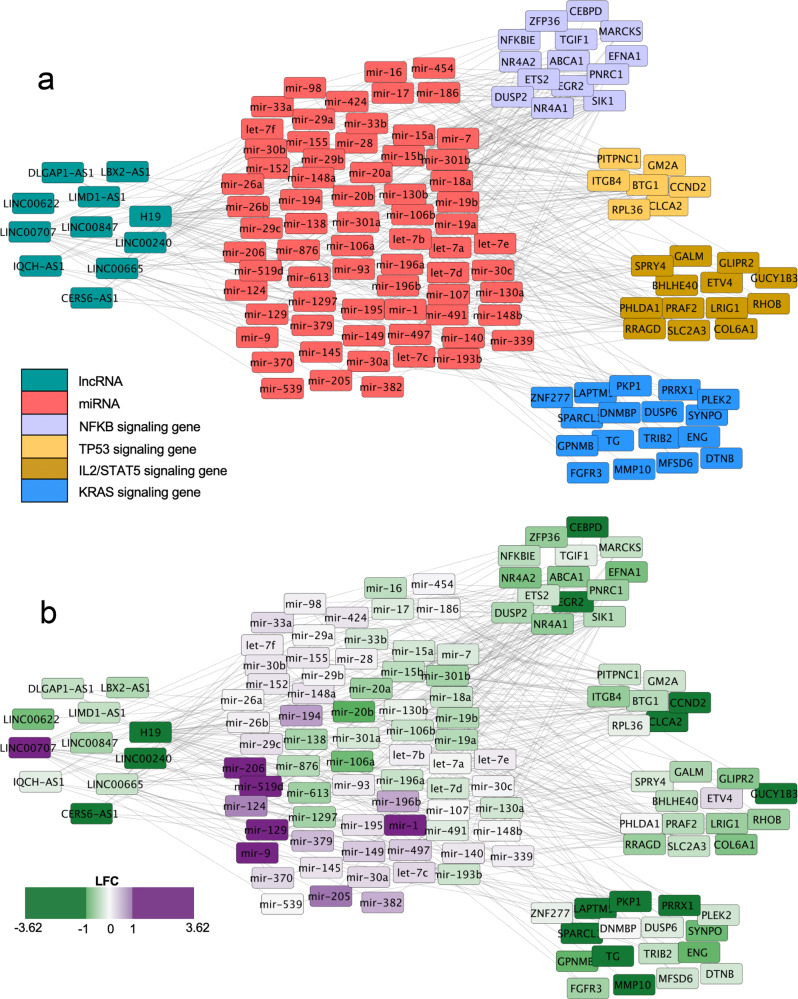
Fig. 4. Dysregulation of lncRNA-miRNA regulatory network causes downregulation of key cancer driver pathways in tumor-derived cell lines.
a Types of genes are identified by color and positioning in the Cytoscape graph. Gene interactions from miRNet databases are denoted by gray lines. lncRNA are on the left, miRNA in the center, and differentially expressed protein-coding genes from each of the four cancer driver pathways are on the right side of the graph. b Positive LFC (purple) denotes higher expression in CCLE. Negative LFC (green) denotes higher expression in TCGA.

