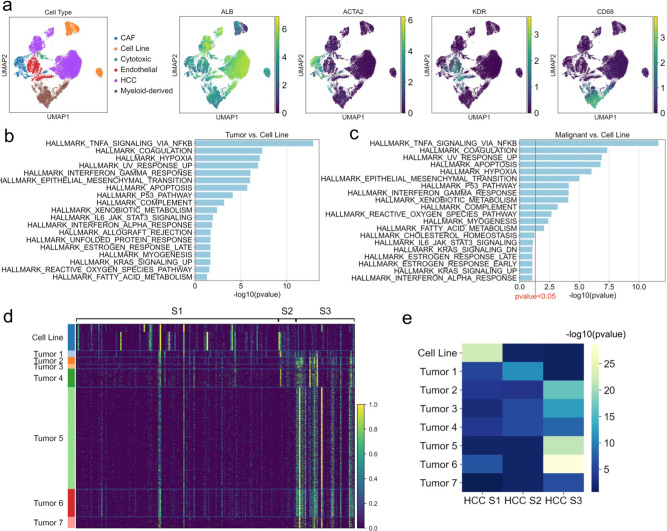
Fig. 5. Single-cell RNA sequencing analysis of hepatocellular carcinoma tumor samples and cell lines.
a Single-cell RNA sequencing data clustering of hepatocellular carcinoma (HCC) cell line and tumor cells. b Gene set enrichment analysis of genes differentially overexpressed in all HCC tumor cells compared to HCC cell-line cells (P value < 0.05). c Gene set enrichment analysis of genes differentially overexpressed in only malignant HCC tumor cells compared to HCC cell-line cells (P value < 0.1, red line denotes P value < 0.05 cutoff). d Heatmap showing relative expression of genes from HCC molecular subtype gene signatures, in HCC cell line and tumor single-cell samples. e Heatmap showing −log10 P values for enrichment of differentially expressed genes in each HCC sample overlapping with the gene signatures for each HCC molecular subtype.

