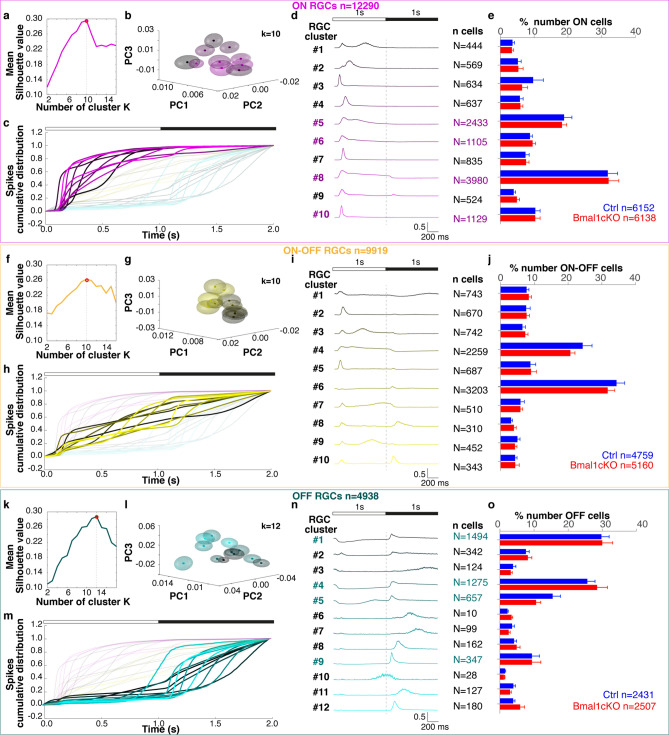
Figure 4.
Functional characterization of ON, ON–OFF and OFF type RGCs detected from responses to full-field flashes in Ctrl and Bmal1cKO retinae under mesopic conditions. (a–f–k) The mean Silhouette analysis (average silhouette values 0.30, 0.26, and 0.28 for ON, ON–OFF, and OFF RGCs, respectively) suggests an optimal number of 10 clusters for ON and ON–OFF RGCs, and 12 for OFF RGCs. “k” represents the number of clusters that maximize the silhouette width. (b–g–l) Principal component analysis (PCA) of ON, ON–OFF, and OFF RGCs. (c-h-m) Cumulative spike trains distribution to alternating 1 s white and 1 s black flashes (20 repetitions, CT100) for ON, ON–OFF, and OFF RGCs. Each line represents the averaged response of the cells belonging to the color-coded cluster. (d–i–n) Population response for ON, ON–OFF, and OFF cells (10 ON, 10 ON–OFF, and 12 OFF clusters) per cluster. Each row shows the normalized PSTH of a single cluster. The numbers on the right of the PSTHs represent the numerosity of each cluster. (e–j–o) The histograms denote the relative proportion of recorded RGCs from each retina (Ctrl in blue and Bmal1cKO in red) assigned to the cluster. Cluster numerosity does not exhibit bias toward one of the two strains (Multiple t-tests correct). Data are shown as mean ± SEM. On the bottom right of each panel, the total amount of ON, ON–OFF, and OFF RGCs recorded in Ctrl and Bmal1cKO. Clusters ON 5, 8, 6, 10 and clusters OFF 1, 4, 5, and 9 represent the most abundant and further analyzed clusters.

