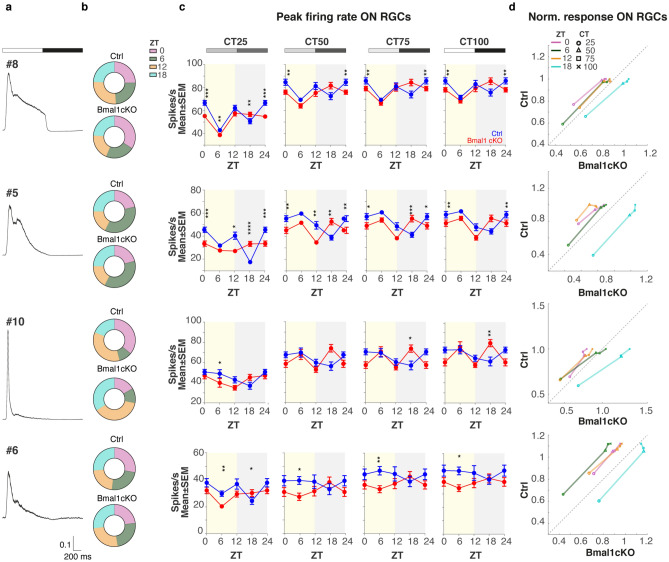
Figure 5.
Bmal1 deletion affects ON RGCs maximum firing rate in response to light in mesopic conditions. (a) Averaged normalized PSTH (mean ± SEM) of all RGCs belonging to the most abundant ON clusters (both genotypes, all ZTs at CT100) #8, #5, #10, and #6 in response to full-field white-black alternating flashes (stimulus indicated above). (b) The proportion of recorded RGCs per ZTs (Top, Ctrl and bottom, Bmal1cKO). All cells from different experiments pulled together. (c) Analysis of the maximum firing rate in response to alternating bright and dark flashes performed on selected ON RGCs clusters (different rows) at four different ZTs (0, 6, 12, 18) and different contrasts (CTs, different columns). Data are shown as mean ± SEM between cells belonging to a specific cluster, separately for Ctrl (blue) and Bmal1cKO (red). Asterisks mark a significant difference between groups. (Kolmogorov–Smirnov test; *P < 0.05, **P < 0.01, ***P < 0.001, ****P < 0.0001). (d) Scatter plots of RGCs peak amplitudes normalized to the maximal response of the control throughout the day in Ctrl (y-axes) vs. Bmal1cKO (x-axes) conditions. Different colors indicate results obtained at diverse ZTs, and the symbols denote contrast conditions. Dashed line: unity line.

