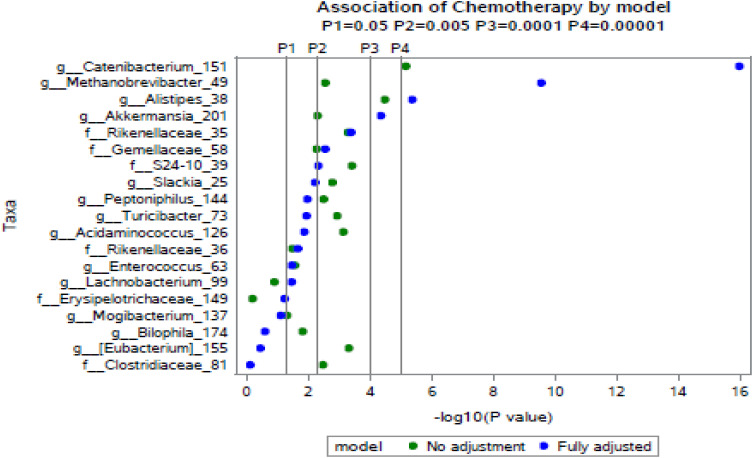
Figure 3.
Significantly differentially abundant taxa (p < 5% significance threshold) between the neoADJ (n = 16) vs. non-neoADJ groups (n = 17). The x-axis indicates the minus log transformed p values, so that values further to the right indicate greater statistical significance. NBMM analyses were used in both models: the unadjusted (model 1, green) and fully adjusted (adjusted for weight changes, days between baseline and final fecal collection, and last antibiotics use) (model 4, blue).

