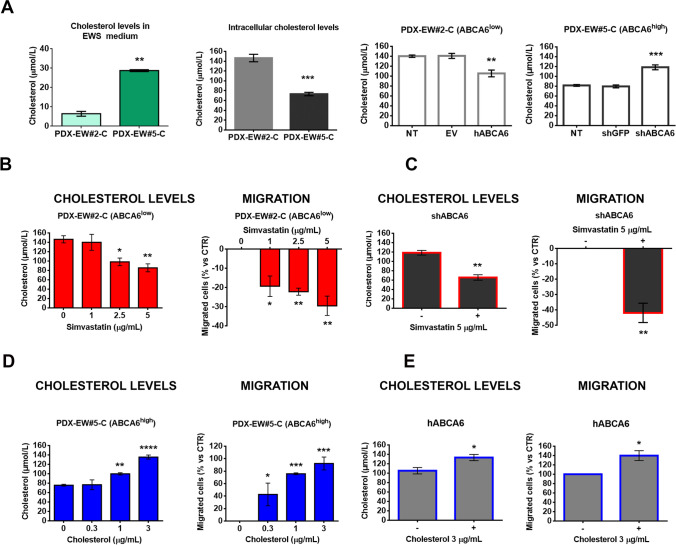
Fig. 4.
Impact of intracellular levels of cholesterol on EWS cell malignancy. a, Total cholesterol quantification by using a colorimetric assay in PDX-EW#2-C cells (ABCA6low) and PDX-EW#5-C cells (ABCA6high), both in the medium and at the intracellular level. Data are the mean ± SEM (n = 3); **p < 0.01; ***p < 0.001, Student’s t-test. Intracellular cholesterol was also quantified in PDX-EW#2-C cells after forced expression and in PDX-EW#5-C cells after silencing of ABCA6. Data are the mean ± SEM (n = 3); **p < 0.01; ***p < 0.001, one-way ANOVA. PDX-EW#2-C cells (non-transfected cells, b) and PDX-EW#5-C silenced cells (c) were exposed to simvastatin (72 h). Graphs represent the effects on intracellular cholesterol levels (mean ± SEM; n = 3) and cell migratory ability (mean ± SEM; n = 3). *p < 0.05; **p < 0.01 versus untreated cells (control, one-way ANOVA or Student’s t test). PDX-EW#5-C (non-transfected cells, d) and PDX-EW#2-C after forced expression (e) are exposed to exogenous cholesterol (72 h). Graphs represent the effects on intracellular cholesterol levels (mean ± SEM; n = at least 3) and cell migratory ability (mean ± SEM; n = 3). *p < 0.05; **p < 0.01; ***p < 0.001; ****p < 0.0001 versus untreated cells (control, one-way ANOVA or Student’s t test)

