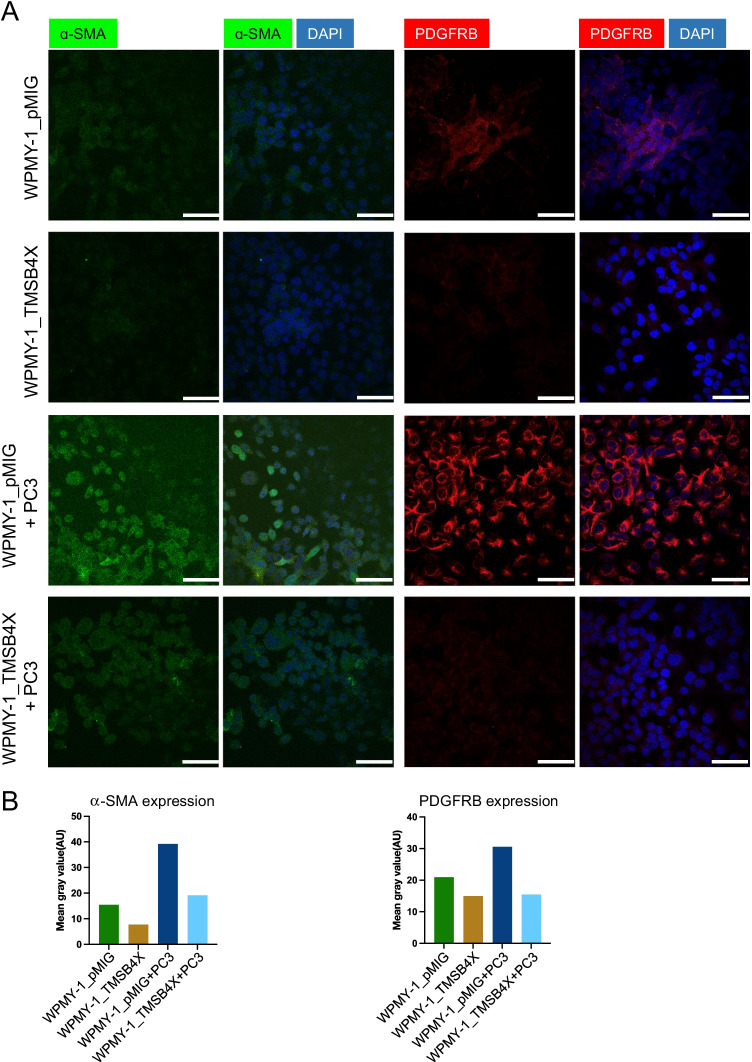
Fig. 8.
Effect of TMSB4X on expression of CAF markers by WPMY-1 cells. A, Effect on α-SMA and PDGFRB expression. Representative immunofluorescence images of WPMY-1_pMIG and WPMY-1_TMSB4X cells in mono-culture and in co-culture with PC3 cells. Nuclei were stained with DAPI in blue, and α-SMA and PDGFRB were stained green and red, respectively. B, Quantification of α-SMA and PDGFRB expression. Y axis represents the mean fluorescence intensity. Scale bar: 30 μm

