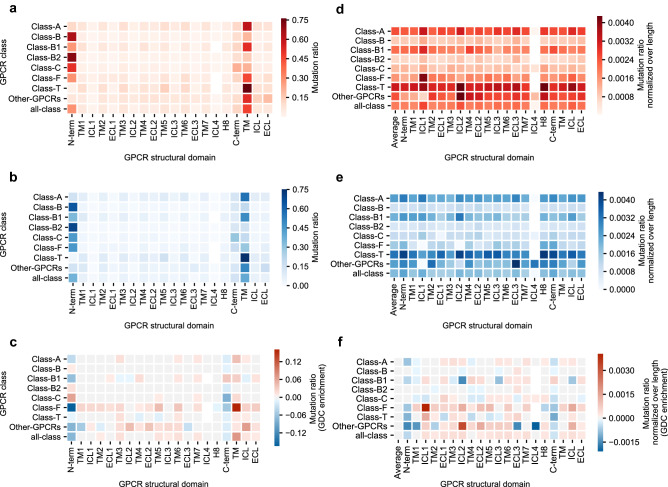
Figure 2.
Distribution of mutation frequencies per GPCR structural domain. (a) Mutation ratio found in each structural domain in the GDC dataset for GPCRs in all classes combined and independently. (b) Mutation ratio found in each structural domain in the 1000 Genomes dataset for GPCRs in all classes combined and independently. (c) Mutation ratio enrichment in the GDC dataset over the 1000 Genomes dataset. (d) Mutation ratio normalized over average domain length found in each structural domain in the GDC dataset for GPCRs in all classes combined and independently. (e) Mutation ratio normalized over average domain length found in each structural domain in the 1000 Genomes dataset for GPCRs in all classes combined and independently. (f) Length-normalized mutation ratio enrichment in the GDC dataset over the 1000 Genomes dataset. “TM”, “ICL” and “ECL” represent the (normalized) mutation ratios in aggregated domains. In panels (d–f), “Average” represents the average ratio considering a domain as the whole protein. In panels (a) and (d), a darker shade of red represents a higher (normalized) mutation ratio in the GDC dataset. In panels (b) and (e), a darker shade of blue represents a higher (normalized) mutation ratio in the 1000 Genomes dataset. In panels (c) and (f), a darker shade of red represents a higher (normalized) mutation ratio enrichment towards the GDC dataset, while a darker shade of blue represents a higher (normalized) mutation ratio enrichment towards the 1000 Genomes dataset.

