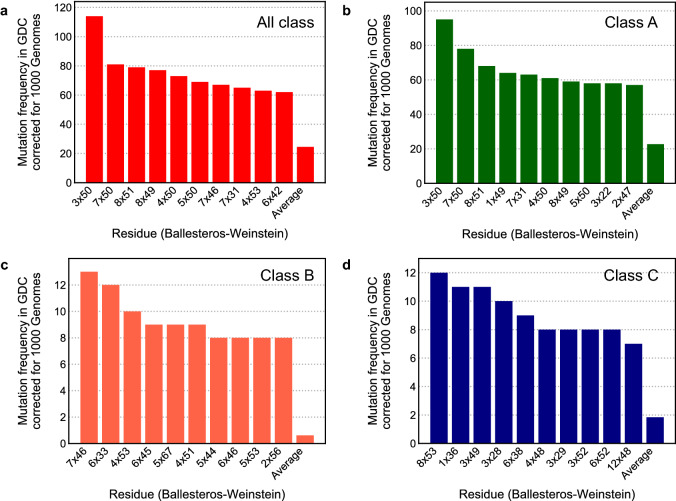
Figure 4.
Most frequently mutated residues in GDC corrected for natural variance. The 10 positions with the highest mutation frequency in GPCRs in the GDC dataset corrected for the mutation frequency in the 1000 Genomes dataset. (a) Analysis of all GPCR classes combined. (b) Analysis of Class A GPCRs. (c) Analysis of Class B GCPRs. (d) Analysis of Class C GPCRs. The residue location in Ballesteros-Weinstein notation is shown on the x-axis, while on the y-axis the corrected mutation frequency of that residue is given. “Average” is the average mutation frequency per residue over all the data.

