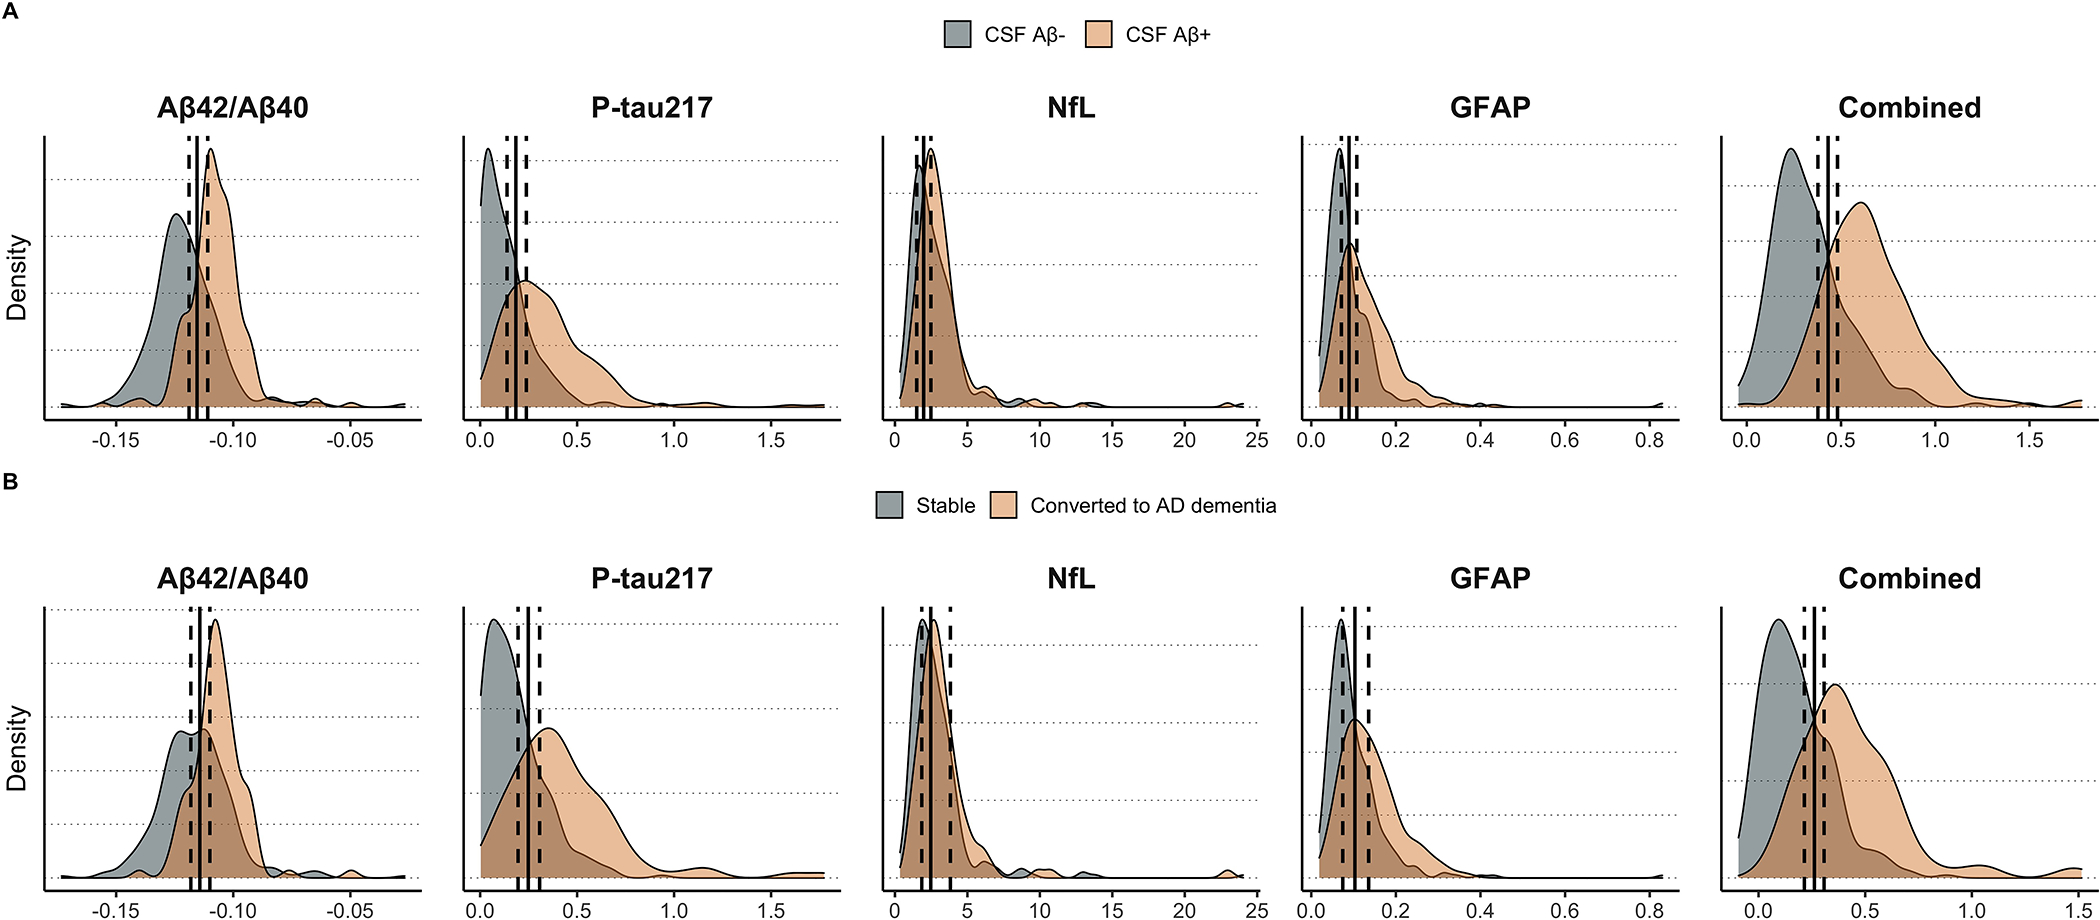
Figure 4. Distribution of plasma biomarker values across diagnostic/prognostic groups and optimal cutoff variability.

This figure demonstrates the distribution of plasma biomarker values (or risk predictions from logistic regression for the combined model) across CSF amyloid-negative and CSF amyloid-positive groups (panel A) or across participants who remained stable versus those who developed AD dementia within four years from baseline (panel B). The optimal cutoff derived from Youden’s index is also plotted for each model, along with the 95% confidence interval of the cutoff as derived from 1000 trials of simulating random error for each biomarker according to empirical estimates of test-retest variability.
