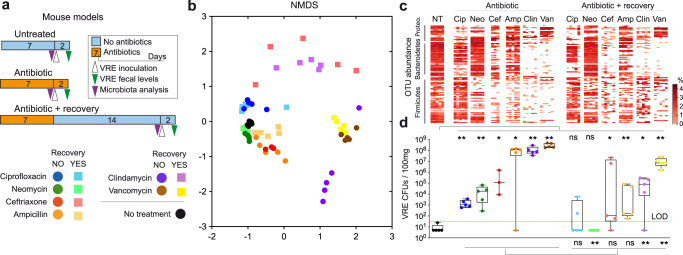
Fig. 1. Different antibiotics induce distinct dysbiotic states and grades of susceptibility to vancomycin-resistant Enterococcus (VRE) intestinal colonization.
a Schematic representation of the mouse model. Mice were treated during seven days with antibiotics of different spectrum (i.e. ciprofloxacin, neomycin, ceftriaxone, ampicillin, clindamycin or vancomycin). Subsequently, a group of mice was orally gavage with 106 VRE colony forming units (CFUs), while another group of mice was allowed to recover for two weeks before VRE inoculation. Faecal samples were collected immediately before VRE inoculation for microbiota analysis and 2 days post-VRE inoculation (p.i). for quantifying VRE levels. As control, faecal samples were collected from a group of untreated mice for microbiota analysis and VRE quantification. b Non-metric multidimensional scaling (NMDS) analysis based on Bray-Curtis distances obtained using the relative abundance of OTUs identified in faecal samples collected from mice. Each point represents the microbiota of one mouse. Color legend is shown in (a) and indicates the antibiotic treatment received. c Heatmap that shows the abundance of the top 100 most abundant OTUs identified in the faecal samples collected. No treatment (NT), Ciprofloxacin (Cip), Neomycin (Neo), Ceftriaxone (Cef), Ampicillin (Amp), Clindamycin (Clin), Vancomycin (Van), Proteo (Proteobacteria). Taxonomy of the OTUs as well as statistical analysis of the OTUs abundance are indicated in Supplementary Data File 2. d VRE faecal levels (CFUs / 100 mg) 2 days p.i. in the mice receiving the different treatments. LOD = limit of detection. Points below the LOD indicate those mice in which we were not able to detect any VRE CFU. *p < 0.05, **p < 0.01, ns – nonsignificant, two-sided Wilcoxon rank-sum test. N = 5 mice per treatment except for ceftriaxone without recovery period in which N = 3 mice. Statistical results shown in panel (d) refer to: above - the comparison of each treated group of mice with the untreated group; below: the comparison of each group of mice treated with a specific antibiotic (before vs after the recovery period). In (d) boxes extend from the 25th to 75th percentiles. The line within the boxes represents the median. Whiskers indicate the maximum and minimum values. Source data are provided as a Source Data file.

