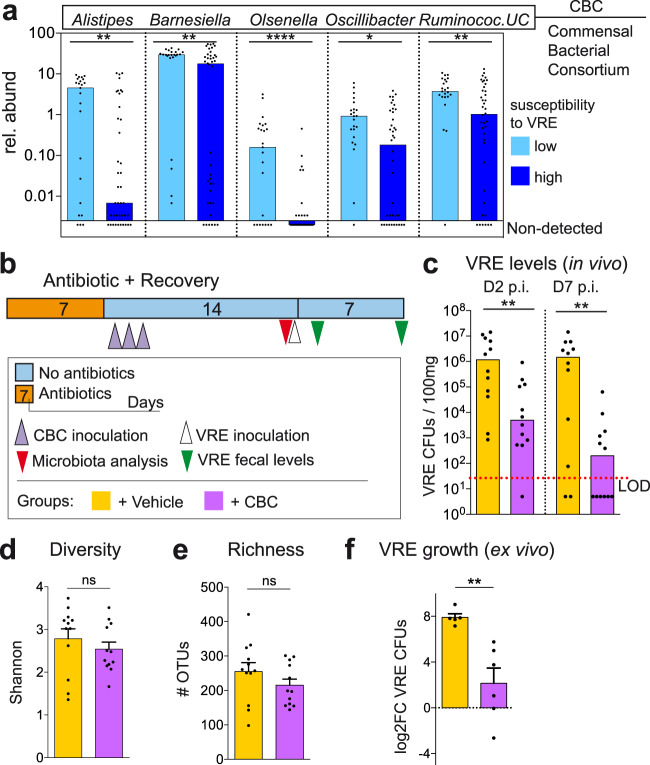
Fig. 2. A consortium of five commensal bacteria restricts vancomycin-resistant Enterococcus (VRE) intestinal colonization during antibiotic-induced dysbiosis.
a Faecal relative abundance (rel. abund) of the five bacterial taxa whose levels were negatively associated with VRE faecal levels (Supplementary Fig. 5, Supplementary Data File 3) and that could be isolated, UC = unclassified. Samples (from Fig. 1) are divided in those collected from mice with high (> 103 VRE colony forming units (CFUs) / 100 mg) or low (< 103 VRE CFUs / 100 mg) susceptibility to VRE intestinal colonization (see methods for the definition of the two groups). CBC (Commensal Bacterial Consortium) is the acronym given to the bacterial mix containing the 5 isolates from the 5 taxa indicated. ****p = 4e−5,**p < 0.01,*p = 0.011. b Schematic representation of the mouse model used. Mouse were treated with vancomycin. One day after antibiotic cessation, mice received CBC orally during 3 consecutive days. Two weeks after antibiotic cessation, a faecal sample was collected immediately before VRE inoculation. VRE faecal levels were quantified 2 and 7 days post-VRE inoculation (p.i.). As control, a group of mice received the vehicle for bacteria administration (PBS-GC) instead of CBC. c VRE levels in faecal samples collected from the group of mice described in (b), **p < 0.006. d Microbiota diversity and (e) microbiota richness (number of Operational Taxonomical Units – OTUs) from the groups of mice described in (b), nsp>0.21. f Ex vivo VRE growth in caecal contents collected from vancomycin-treated mice that received CBC or PBS-GC after stopping antibiotic treatment. Caecal contents were collected 2 weeks after stopping antibiotic treatment. Each point is a biological replicate (i.e. caecum collected from a different mouse). Values represent the change (log2FC) in VRE levels after 24 h of growth, **p = 0.004. Two-sided Wilcoxon rank-sum test for (a and c) and two-sided t-test for (d–f), ns - nonsignificant. N = 23 and 40 mice per group in (a), N = 12 mice per group in (c–e), N = 5 biologically independent samples per group in (f). Bars represent the median in (a and c) and the mean in (d–f). Whiskers represent the SEM. Source data are provided as a Source Data file.

