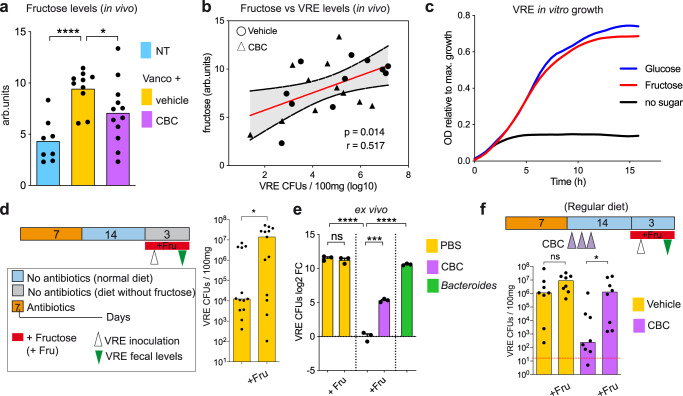
Fig. 4. The commensal bacterial consortium (CBC) restricts vancomycin-resistant Enterococcus (VRE) intestinal colonization through nutrient competition by depleting fructose, a sugar that boosts VRE growth in vivo.
a Caecal fructose levels of mouse groups described in Fig. 3. arb.units: arbitrary units,****p = 5.1e-5,*p = 0.047. b Two-sided Pearson correlation analysis between the caecal fructose levels and faecal log10 VRE colony forming units (CFUs) detected in paired co-housed mice 2 days after VRE inoculation, p = 0.014. The red line represents the linear regression mean and the dotted line the 95% CI. c VRE growth in minimal medium containing fructose, glucose or no extra carbon source. The figure indicates the relative growth compared to the sugar that allowed a highest growth (i.e. maltotriose, Supplementary Fig. 13). d Mice were inoculated with VRE 2 weeks after vancomycin treatment cessation. One day before, mice were fed with a diet that do not contain fructose (see methods) and half of the mice received fructose (Fru) in their drinking water. VRE levels were quantified in faeces 2 days after VRE inoculation, *p = 0.043. e Filtered caecal contents from mice that recovered from vancomycin treatment were inoculated with PBS, CBC or Bacteroides. 24 h after, VRE was inoculated and the change in VRE levels was quantified 6 h later. + Fru indicates that immediately before VRE inoculation an excess of fructose was added to the culture,nsp = 0.459,***p = 0.0002,****p < 1.2e-5. f 2 weeks after vancomycin cessation mice were inoculated with VRE. One day after vancomycin cessation mice received CBC or the bacterial vehicle (PBS-GC) instead. Half mice from each group received fructose in the drinking water, starting one day before VRE inoculation. Faecal VRE levels were quantified 2 days post-inoculation, nsp = 0.16, *p = 0.021. Two-sided t-test for (a and e); two-sided Wilcoxon rank-sum test for (d and f), ns – nonsignificant. N = 8, 10 and 12 mice per group in (a). N = 22 mice in (b). N = 13 mice per group in (d). N = 3 biologically-independent samples per group in (e). N = 8 mice per group in (f). Bars represent the mean in (a and e) and the median in (d and f). Red line in (f) represents the limit of detection. Source data are provided as a Source Data file.

