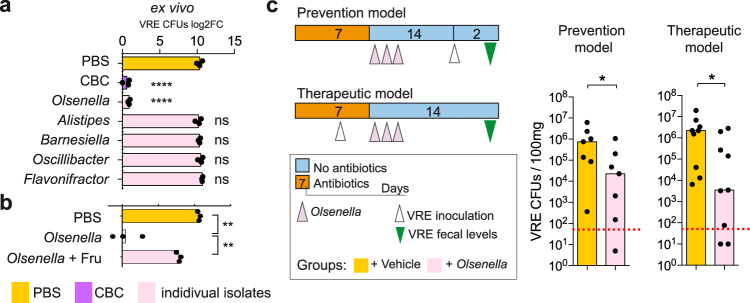
Fig. 5. Olsenella recapitulates the inhibitory effect of the bacterial consortium (CBC) against vancomycin-resistant Enterococcus (VRE) colonization.
a, b Filtered caecal contents from mice that recovered from vancomycin treatment were inoculated with either PBS, CBC or individual isolates as depicted. 24 h after incubation at 37 °C under anaerobic conditions, VRE was inoculated and the growth was quantified 6 h later. Values represent the change (log2) in VRE levels after the 6 h. + Fru indicates that immediately before VRE inoculation an excess of fructose was added to the culture, ****p < 1.17e-5,**p < 0.005,nsp > 0.188. c Prevention model: mice were treated with vancomycin and one day after stopping antibiotic treatment received either Olsenella or PBS-GC for 3 consecutive days. Two weeks after antibiotic withdrawal mice were inoculated through oral gavage with VRE and VRE colony forming units (CFUs) were quantified 2 days later in faeces. Therapeutic model: mice were treated with vancomycin for 4 days and inoculated with VRE. Mice were maintained on vancomycin for 3 more days. One day after stopping antibiotic treatment, mice received Olsenella for 3 consecutive days or PBS-GC. Two weeks after stopping antibiotic treatment VRE levels were measured in faeces, *p < 0.05. Two-sided t-test for (a and b). Statistics in (a) refer to the comparison with the PBS group, ns – nonsignificant. One-sided Wilcoxon rank-sum test for (c). N = 3 biologically independent samples in (a and b). N = 7 mice per group in the prevention model and N = 9 mice per group in the therapeutic model in (c). Bars represent the mean in (a and b) and the median in (c). Red line in (c) represents the limit of detection. Source data are provided as a Source Data file.

