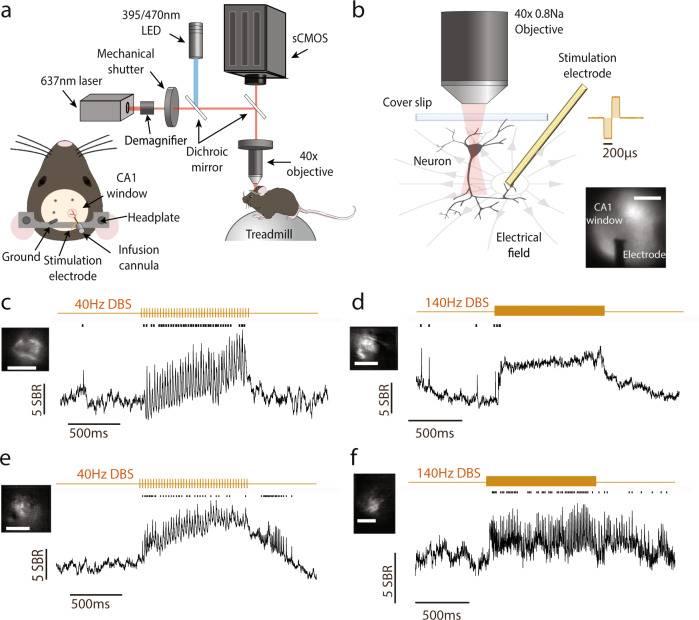
Fig. 1. Single-cell SomArchon fluorescence voltage imaging enables artifact-free neural recordings during DBS.
a Illustration of the experimental setup, the optical imaging window, and the animal preparation. The schematic was adapted from Piatkevich et al. 2019. b Schematic representation of a recorded CA1 neuron in the electric field generated by the electrode a few hundred microns away, and an example empirically measured electrical stimulation waveform. Lower right is an example imaging field showing GFP fluorescence from neurons expressing SomArchon-GFP and CoChR and the shadow of the nearby electrode. Scale bar 500 µm. The schematic neuron was adapted from Scidraw (doi.org/10.5281/zenodo.3925905). c Example SomArchon fluorescence before, during and after 40 Hz DBS. Average SomArchon fluorescence of an example neuron is shown in the upper left image. Scale bar, 15 µm. SomArchon trace is shown in black, detected spikes are marked by black ticks and electrical stimulation pulse patterns are in gold. SBR is the spike-to-baseline ratio, defined as the average spike amplitude divided by the standard deviation of the subthreshold SomArchon trace fluctuation for each recorded neuron (see methods). d Same as (c), but for 140 Hz DBS. e-f Same as (c-d), but other single neuron trial examples.

