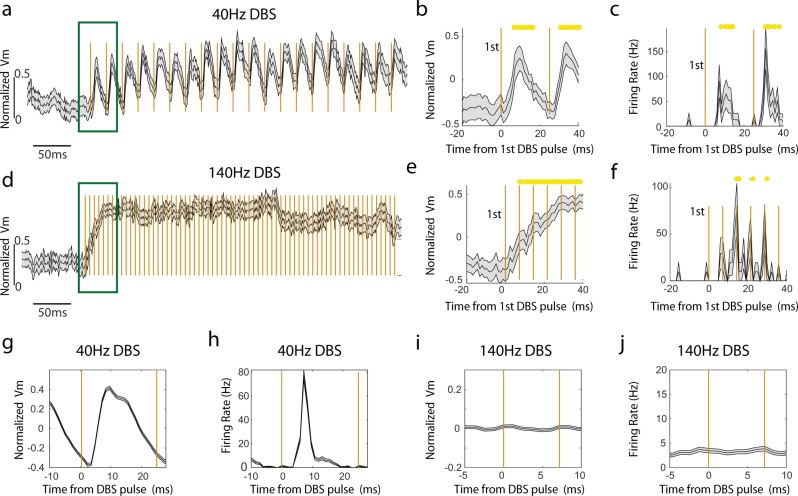
Fig. 3. Individual electrical pulse evoked Vm and firing rate modulations are DBS frequency dependent.
a The population-averaged Vm trace before, during and after 40 Hz DBS with the pulse onset times indicated by the golden vertical lines. Green box indicates the time windows where zoom-in versions are shown in b, e. Shaded area represents SEM. Vm is calculated as the fluorescence at each time point divided by the average amplitude of all spikes detected in a recording session for a given neuron. DBS-induced Vm changes were computed as normalized Vm by subtracting the mean of the Vm during the prestimulation baseline period. b The population-averaged Vm trace (n = 22 neurons) around 40 Hz DBS onset. Shaded area represents SEM. Time window as indicated in (a). Time zero corresponds to the first DBS pulse time. Yellow dots represent Vm modulations during DBS that are two standard deviations from the baseline Vm distribution. c Same as (b), but showing the population-averaged firing rate. d–f Same as (a-c), but for 140 Hz DBS (n = 26 neurons). g Population-averaged Vm aligned to the onset of all pulses during 40 Hz stimulation. Golden lines indicate the pulse onset times. Shaded area represents SEM. h Same as (g), but for firing rate. i-j Same as (g, h), but for 140 Hz DBS.

