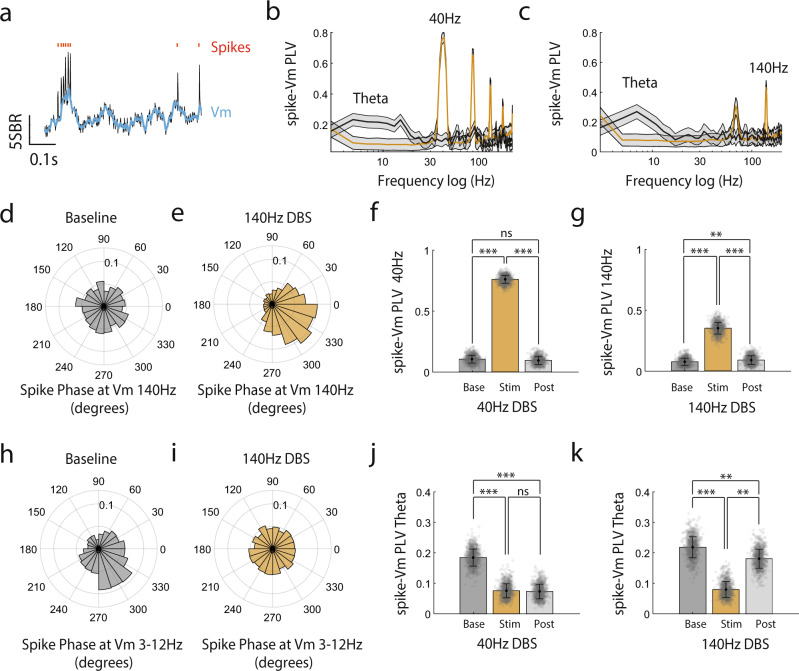
Fig. 4. DBS entrains CA1 spiking at the stimulation frequency while reducing theta-rhythmic spike output.
a Example SomArchon trace (black) of a CA1 neuron with Vm highlighted blue (smoothed ± 6 ms), and spike times marked with red ticks. b Population phase-locking value (PLV) of spikes to Vm across frequencies. Spikes from all neurons were concatenated for PLV computation (40 Hz, n = 1972, 140 Hz, n = 1867). Black line represents spike-Vm PLV during baseline period and golden line represents spike-Vm PLV during 40 Hz DBS period. Shaded area is standard deviation estimated through bootstrapping. Frequency-axis is on a logarithmic scale. c Same as (b), but for 140 Hz DBS. d The population polar histogram of spike times relative to the phase of Vm filtered at 140 Hz using a Butterworth filter during the baseline period. e Same as (d), but during the 140 Hz DBS period. f Quantification of spike-Vm PLV at the DBS 40 Hz entrainment frequency during baseline (Base), 40 Hz DBS (Stim) and post-stimulation (Post) periods. Black error bars are standard deviation. Individual data points represent population mean samples obtained by bootstrapping. g Same as (f), but for 140 Hz DBS. h The circularly averaged population polar histogram of spike times relative to the phase of Vm filtered between 3–12 Hz (theta-frequency range). i Same (h), but during the 140 Hz DBS period. j Quantification of spike-Vm PLV in the theta-frequency range, averaged across 3–12 Hz, during baseline (Base), 40 Hz DBS (Stim) and poststimulation period (Post). Individual data points represent population mean samples obtained by bootstrapping. k Same as (j), but for 140 Hz DBS. Statistics are based on permutation testing comparing estimated values to permutation-derived null distributions, ns = non-significant, **<0.01, and ***<0.001. Source data are provided as a Source Data file.

