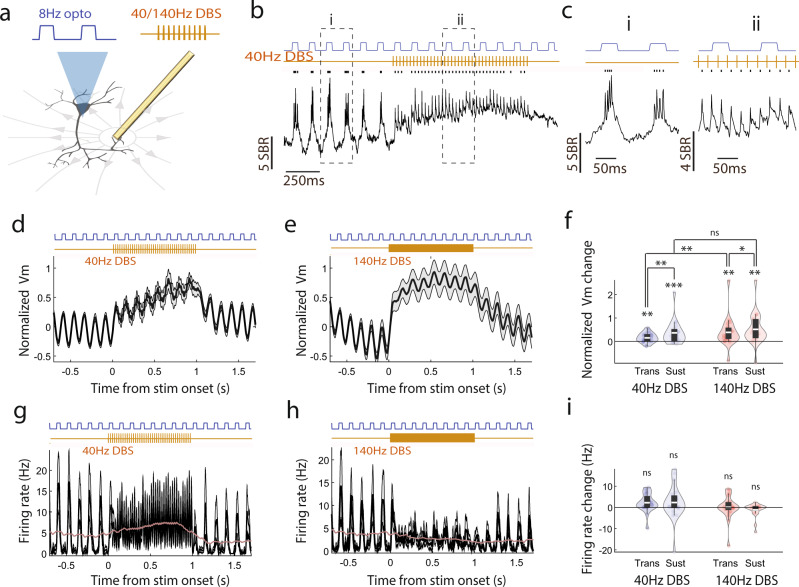
Fig. 5. DBS evokes additional Vm depolarization without changing the spike rate in the presence of CoChR optogenetic inputs.
a Illustration of simultaneous CoChR-evoked membrane depolarization and SomArchon voltage imaging during DBS. Optogenetic blue light stimulation was delivered wide-field over an area of 350 microns defined by the 40x objective. Schematic neuron was adapted from scridraw.io (doi.org/10.5281/zenodo.3925905). b An example CA1 neuron’s SomArchon fluorescence trace (black) and spikes (black ticks) during 8 Hz CoChR activation (blue line) and 40 Hz DBS (gold line). 8 Hz CoChR activation occurred throughout the 3-second trial, whereas 40 Hz DBS occurred for 1 second in the middle of each trial. c Zoom-in view of the periods indicated by the dashed lines in (b), during the baseline (i) and the DBS period (ii). d Population-averaged Vm during simultaneous 8 Hz optogenetic activation (blue) and 40 Hz DBS (gold). Vm is calculated as the fluorescence at each time point divided by the average amplitude of all spikes detected in a recording session for a given neuron (n = 20). DBS-induced Vm changes were computed as normalized Vm by subtracting the mean of the Vm during the pre-stimulation baseline period. Shaded area represents SEM. e Same as (d), but with 140 Hz DBS (n = 21). f Quantification of the transient (0–0.15 sec) and the sustained (0.15–1 sec) Vm depolarization induced by either 40 Hz or 140 Hz DBS, in the presence of optogenetic activation. Data are visualized as violin plots with the outer shape representing the data kernel density and a box plot showing the interquartile range (1x, 1.5x). The white lines in the boxes are the mean. For 40 Hz DBS, paired t-test, df = 19, transient: p = 0.0036; sustained: p = 0.004, transient vs. sustained: p = 0.028. For 140 Hz DBS, paired t-test, df = 20; transient: p = 0.01, sustained: p = 0.0025, transient vs. sustained: p = 0.0187. Comparison between 40 Hz and 140 Hz DBS, independent t-test, df = 39, transient: p = 0.0082; sustained: p = 0.42. (g). Population-averaged firing rate during simultaneous 8 Hz optogenetic activation (blue) and 40 Hz DBS (brown, n = 16 neurons). Shaded area represents SEM. The purple line represents the further smoothed firing rate (300 ms rectangular smoothing). h Same as (g), but for population-averaged firing rate with 140 Hz DBS (n = 17). i Violin plots of the transient (0–0.15 sec) and the sustained (0.15–1 sec) firing rate changes relative to the baseline induced by either 40 Hz or 140 Hz DBS, in the presence of optogenetic activation. For 40 Hz DBS, paired t-test, df = 19, transient: p = 0.062; sustained: p = 0.28. For 140 Hz DBS, paired t-test, df = 20; transient: p = 0.76, sustained: p = 0.087. Given DBS conditions were not significant from baseline, we did no comparison across DBS conditions. Two-sided paired t-test for within DBS condition statistics and two-sided independent t-test for between DBS condition statistics. ns, non-significant, *<0.05, **<0.01, and ***<0.001. Source data are provided as a Source Data file.

