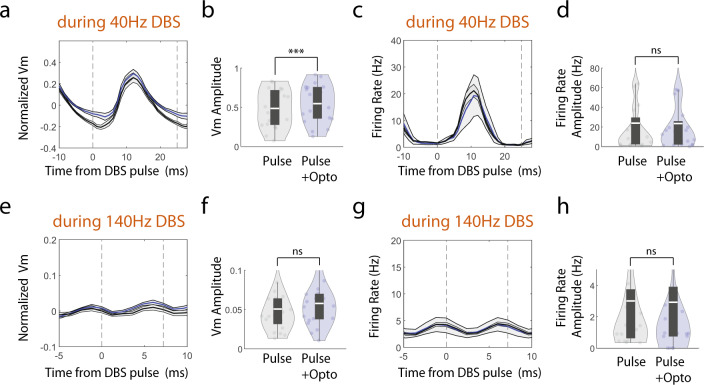
Fig. 6. Individual electrical pulse evoked Vm and firing rate changes are differentially modulated by optogenetic depolarization.
a Population-averaged Vm aligned to individual electrical pulses during 40 Hz DBS with simultaneous optogenetic CoChR activation (blue line) and without CoChR activation (black line). Dashed lines indicate the onset of individual DBS electrical pulse times. Pulse-averaged Vm was first computed for each neuron and then averaged across neurons. Normalized Vm was then computed by subtracting the mean of the population pulse averaged Vm during the 10 ms (40 Hz DBS) or 5 ms (140 Hz DBS) time period before pulse onset. Shaded area represents SEM. b Electrical pulse evoked Vm change, computed as the difference between the maximum minus the minimum of the pulse averaged Vm per neuron. Data are visualized as violin plots with the outer shape representing the data kernel density and a box plot showing interquartile range (1x, 1.5x). The white lines in the boxes are the mean. Paired t-test, p = 3.3 × 10⁻⁵, df = 19. c, d Same as (a,b), but for population-averaged firing rate aligned to individual electrical pulses during 40 Hz DBS. Paired t-test, p = 0.7, df = 19 (e-h) Same as (a-d), but for 140 Hz DBS. Paired t-test (Vm), p = 0.088, df = 20. Paired t-test (Firing rate), p = 0.15, df = 20. Two-sided paired t-test for all tests. ns = non-significant and ***<0.001. Source data are provided as a Source Data file.

