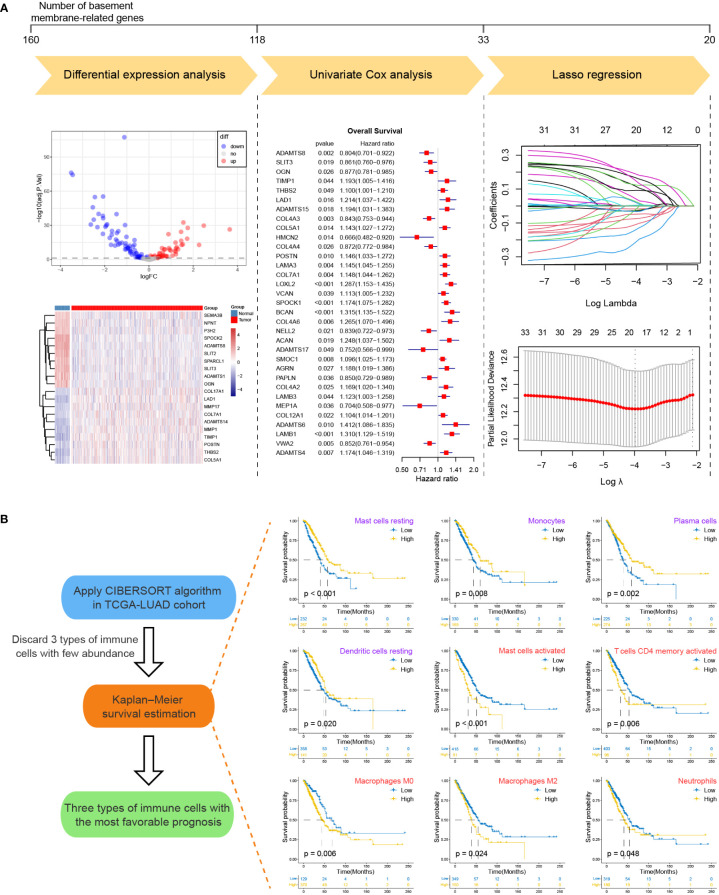
Figure 1.
The workflow for screening basement membrane-related genes and immune cell types for establishing the BM score and TME score. (A) Differential expression analysis, univariate Cox regression analysis and lasso regression analysis were performed for 160 BM-related genes in TCGA-LUAD cohort in succession. The upper line marked the number of BM-related genes before and after each step analysis. Briefly, 20 BM-related genes were selected for the development of BM score. (B) The CIBERSORT algorithm was applied to generate the abundance of 22 types of immune cells for TCGA-LUAD samples. After abandoning 3 types of immune cells with few abundances, Kaplan-Meier survival curve estimation was executed for the remaining immune cell types. Kaplan-Meier overall survival curves were shown on the right side only for immune cell types with p-values less than 0.05 (purple indicated favorable prognostic factor while red represented unfavorable prognostic factor). Ultimately, mast cells resting, monocytes and plasma cells were used for the establishment of TME score.

