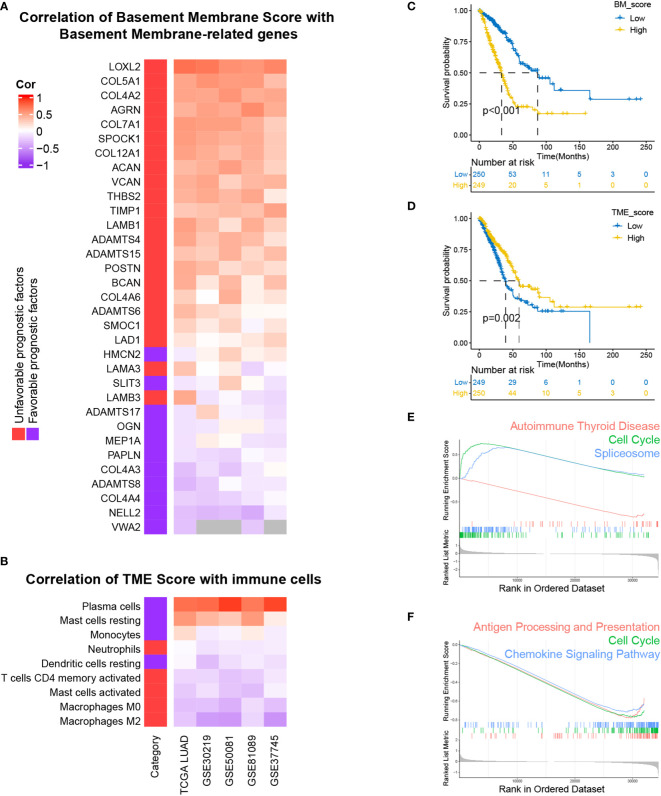
Figure 2.
Development and performance of BM and TME scores in LUAD, respectively. (A, B) The correlation of BM score and TME score with the expression levels of prognostically BM genes and the abundance of prognostically immune cells. (C, D) Kaplan–Meier survival curves of high and low BM, TME scores subgroups. (E, F) Top three KEGG enrichment pathways based on GSEA analysis of differentially expressed genes (DEGs) between high and low BM, TME scores groups.

