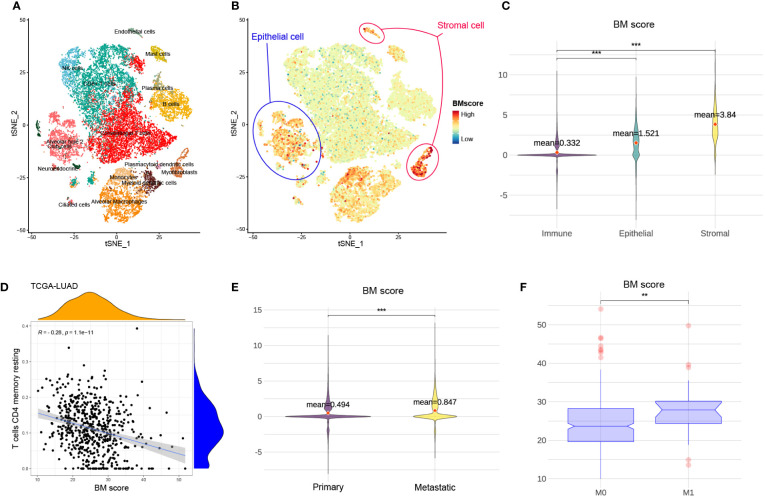
Figure 3.
The relationship between BM score and different types of cells and tumours. (A) t-SNE scatters plot of eight primary and five metastatic LUAD samples with cell annotation. (B) The distribution of BM scores at the single cell level. Blue and red circles represent epithelial and stromal cells, respectively. The rest of the scatter plot is filled with immune cells. (C) The violin plot demonstrating the difference in BM score among immune, stromal and epithelial cells. And the red dots indicate the average value of BM scores for each group. (D) The relationship between BM score and the abundance of T cells CD4 memory resting in TCGA-LUAD cohort. (E) The violin plot showing the difference in BM score between primary and metastatic LUAD tumour cells. Further, the red dots indicate the average value of BM scores for each group. (F) The distribution of BM score between tumours with non-metastatic (M0) and metastatic (M1). **p<=0.01 and ***p<=0.001, respectively.

