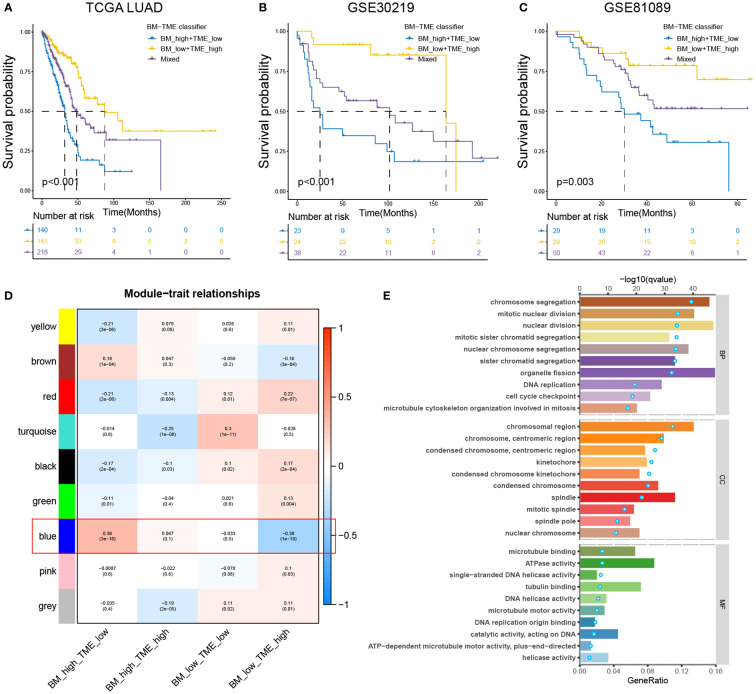
Figure 4.
Prognostic value and enrichment analysis relevant to BM-TME classifier. (A–C) Kaplan–Meier overall survival curves of the training set (TCGA-LUAD cohort) and validation sets (GSE30219 and GSE81089 cohort) based on BM-TME classifier. (D) Heat map depicting the correlation between various gene modules of WGCNA analysis and BM-TME subgroups. (E) Top ten biological process (BP), cellular component (CC) and molecular function (MF) enrichment pathways based on GO analysis of blue module genes. Bar plots correspond to the lower axis; dot plots correspond to the upper axis.

