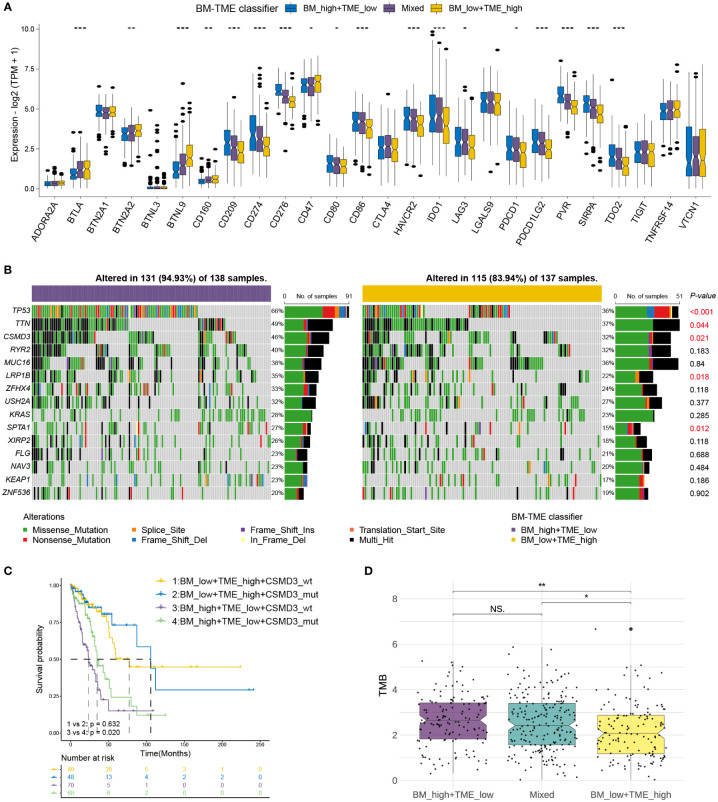
Figure 6.
Correlations of immune checkpoints and somatic mutation with BM-TME classifier in TCGA-LUAD cohort. (A) The differential expression levels of immune checkpoint genes among BM-TME classifier subgroups. (B) Waterfall plots depicting the mutation landscape of the top 15 genes with high mutation frequency. P-values on the right side displaying the significance of differences in 15 gene mutation frequencies between two BM-TME groups. (C) Kaplan–Meier curves of patients with LUAD divided by the CSMD3 mutation status and BM-TME classifier. (D) The distribution of TMB among different BM-TME classifier subgroups. *p<=0.05, **p<=0.01 and ***p<=0.001, respectively. ns, no significance.

